Monitoring and Data Analysis
Device Monitoring
Users connect to the Sternum Platform to monitor devices, view device alerts and traces for investigation and troubleshooting, and create custom trace filters, dashboards, reports and alerts.
Sternum EIV SDK
The EIV SDK allows developers to trace and monitor the different device metrics, logs and functionalities. Like alerts, traces are sent to the Sternum Platform, where they are automatically processed by Sternum Platform analytics and threat & anomaly detection. Refer to the documentation to learn about general integration and how to add custom traces.
The SDK can also be installed standalone without EIV on iOS, Android, Linux and all RTOSes, supporting the following languages: Kotlin, Java, Objective-C, C and C++. Refer to the SDK documentation.
Embedded Traces
The following traces are embedded in the firmware using the SDK to support the security and observability use cases:
| Trace |
|---|
| CPU Usage |
| Heap Usage |
| Boot |
| Task Started |
| WiFi Connection In Progress |
| WiFi Connected |
| MQTT Init Failed |
| MQTT Connection With Broker Established |
| MQTT Reconnection With Broker Established |
| MQTT Connection Failed |
| MQTT Incoming Message |
| Error |
| Update Start |
Monitoring Device Status
On the Sternum Platform, you can monitor the entire device fleet or a specific device. On the Sternum Platform's left menu:
Open the Fleets View to see the data and alerts for the devices in the fleet. Select the fleet thru the Product dropdown at the top of the screen.
Open Inventory to select a specific device. The device view will show deep information about the device’s functionality to facilitate its monitoring.
Available information includes but is not limited to:
- Internet connections
- Events over time
- Triggered alerts
- Device performance
To view the device traces, select the Log tab:
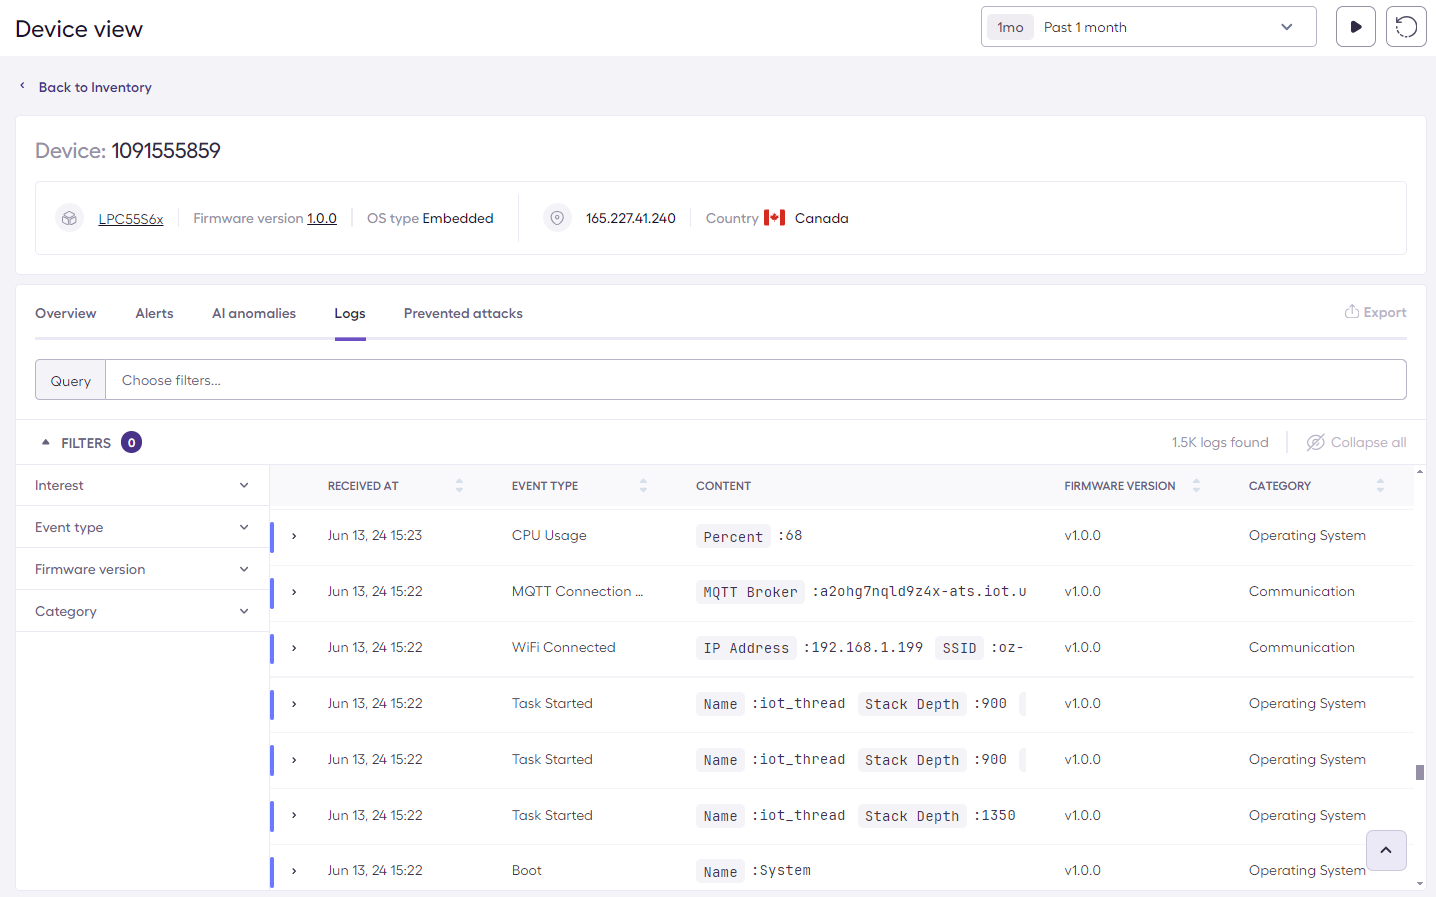
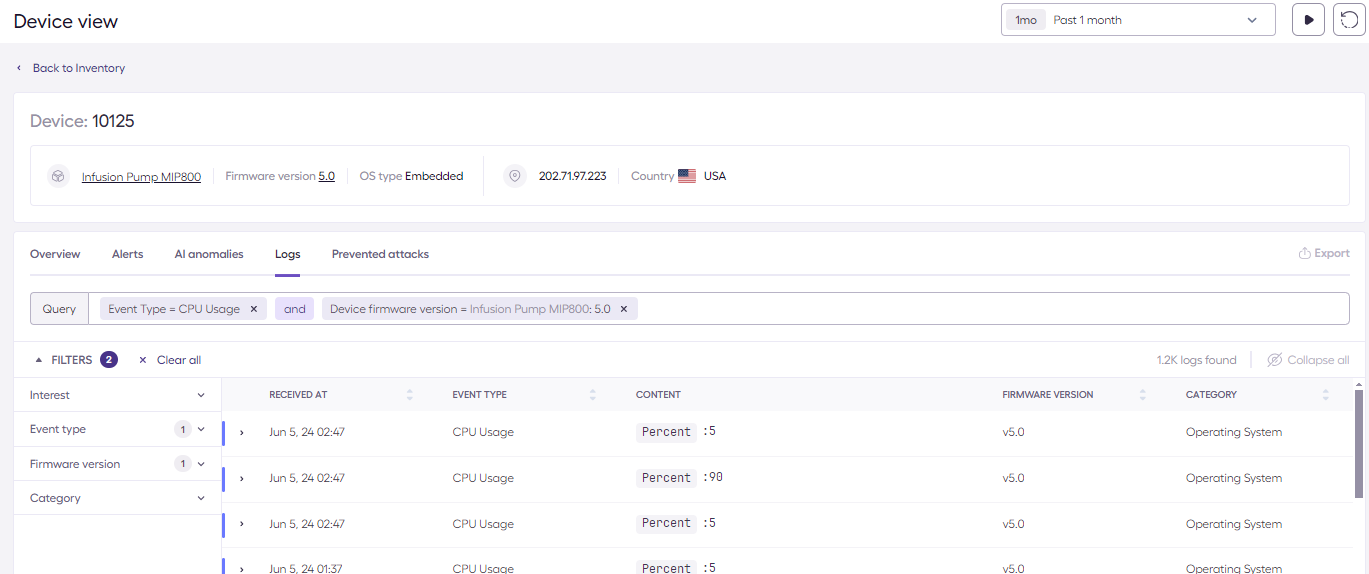
You can use filters on the device or fleet view to only display specific events, for example CPU Usage for device with firmware version 5.0 :
Configurable Alerts
In addition to the reporting of device traces and security alerts generated by EIV in the device, the Sternum Platform enables the creation of custom alerts based on any data generated by the devices.
You can for example create custom alerts to monitor high levels of CPU or memory usage, a device connection to unknown IP addresses, etc. Refer to the Sternum Platform's Events and Alerts for examples and how to configure such alerts.
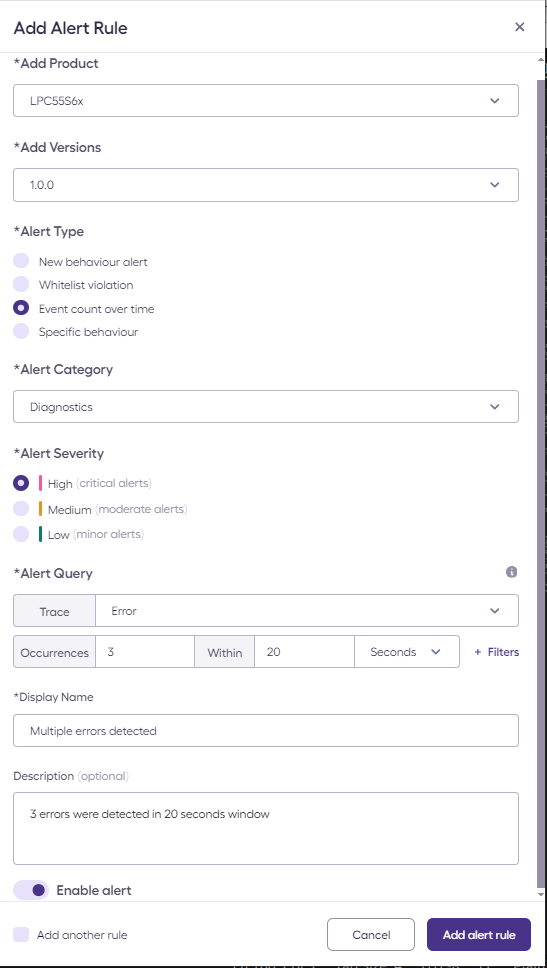
Here is an example of definition of a custom alert for the detection of multiple consecutive errors:
To trigger this alert, run the python script with the Bad IP Address scenario multiple times:
python3 attack_utility.py -d 123456789 -s set_ip_address_error
Each time, the script sends a ‘set ip address’ command with a bad IP address, which in turn cause an Error event to be sent to the Sternum Platform.
The Sternum Platform will monitor the above alert condition (3 such errors in less than 20 seconds) and generate the corresponding alert.
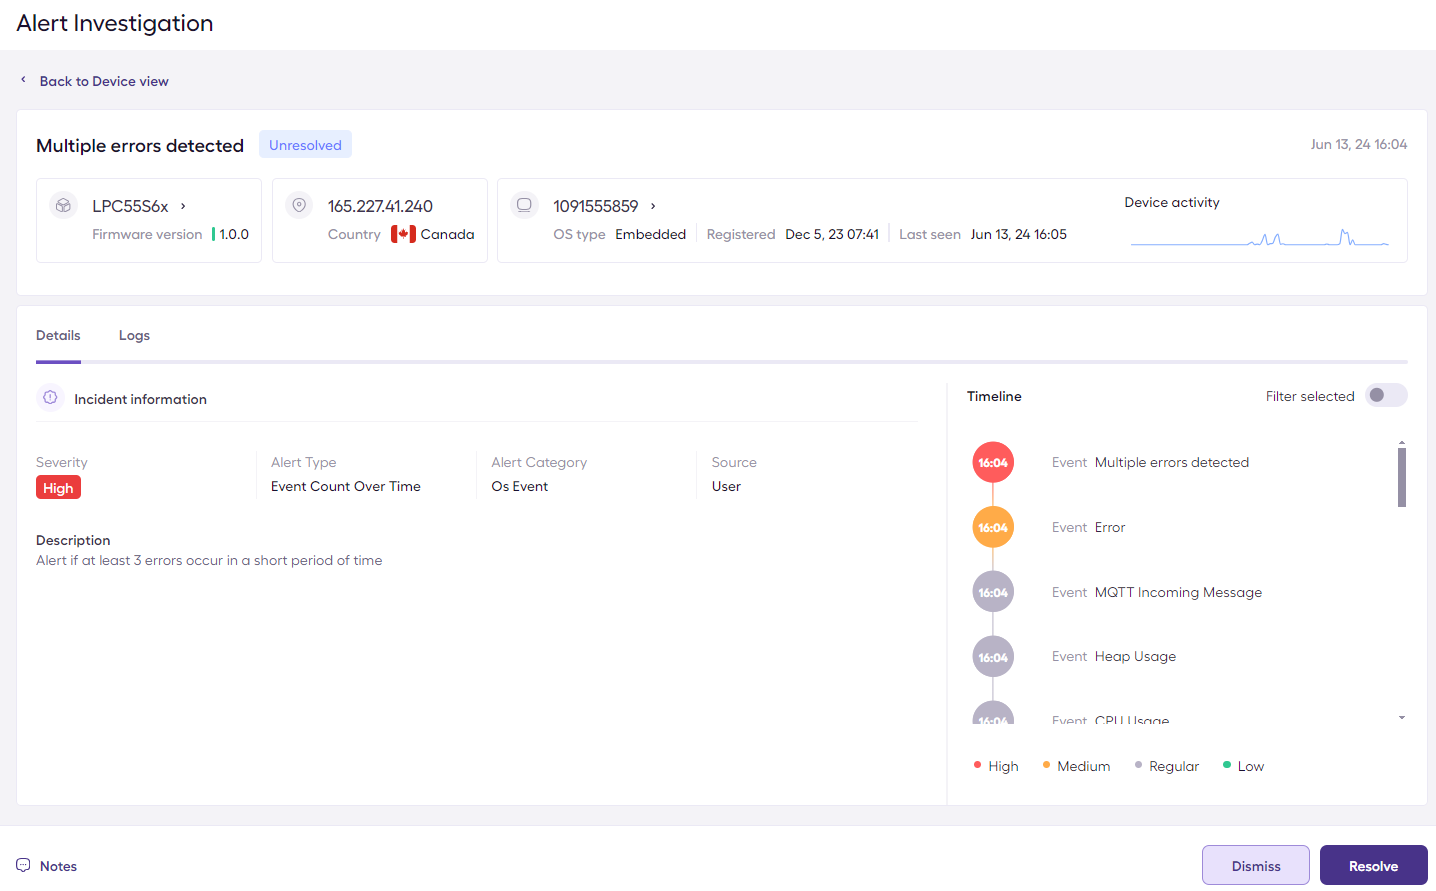
The alert will be visible in the investigation section in the Sternum Platform, and will show the alert and the events preceding it:
Predefined Alerts
The Sternum Platform preconfigures a list of alerts when creating a new device. Refer to the Sternum Platform documentation to learn more about these alerts.
Data Analytics, Reporting & Dashboards
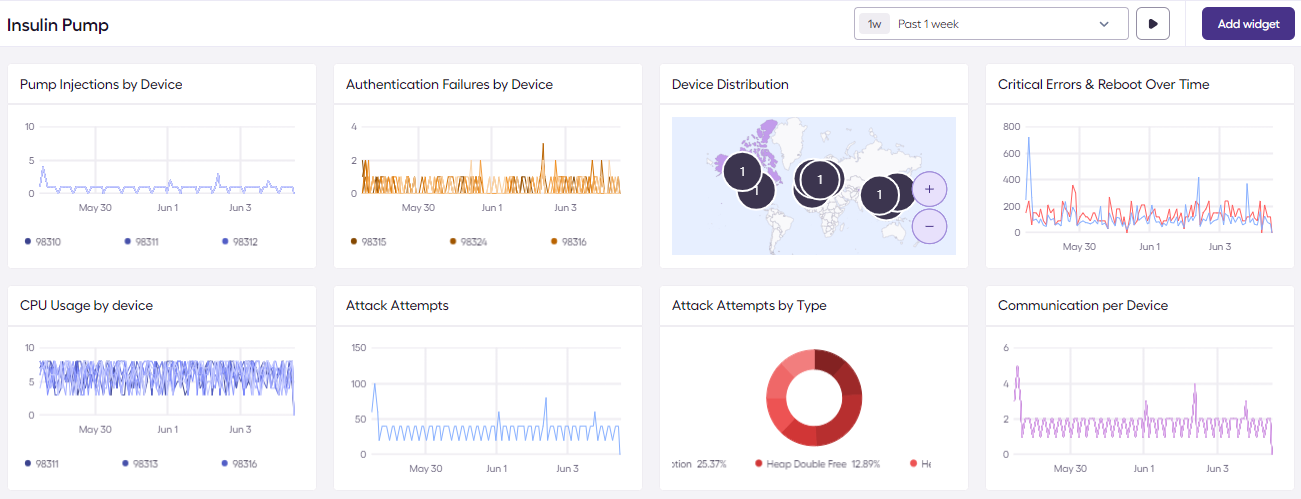
The Sternum Platform provides powerful data reporting capabilities allowing you to create custom dashboards based on any device data. Refer to the Sternum Platform's Dashboards for examples and how to create dashboards and associated charts.
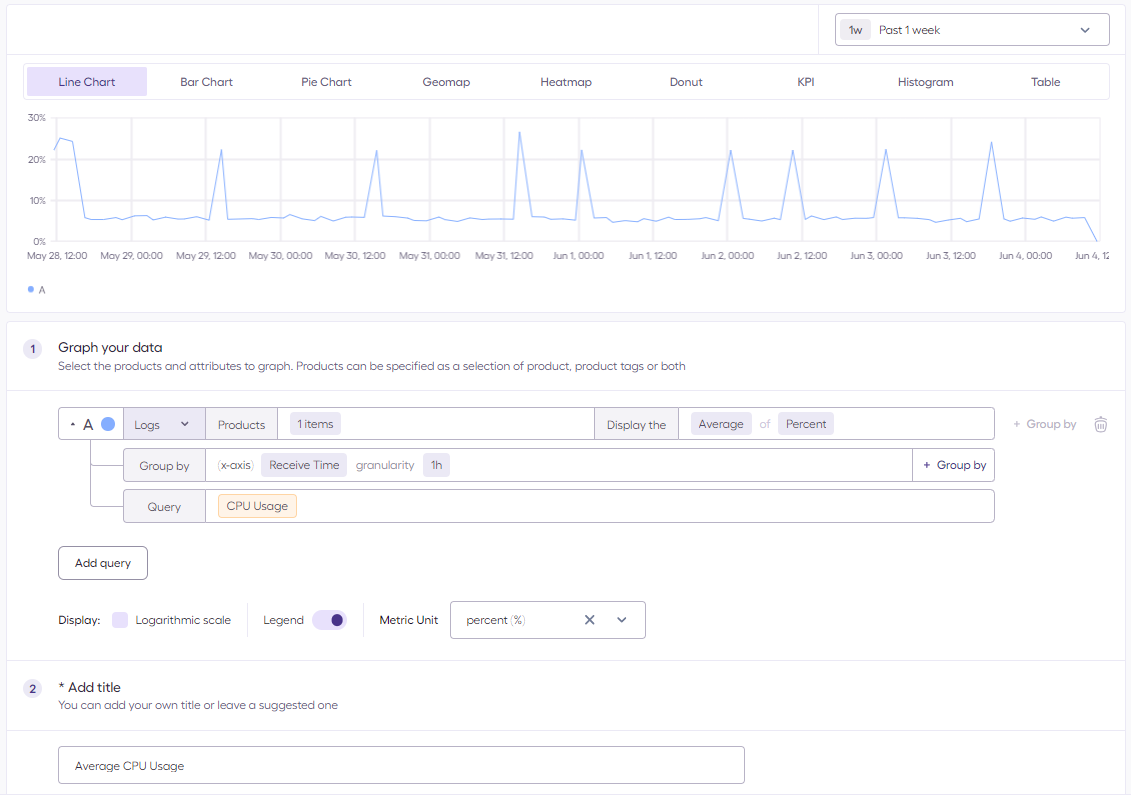
Different type of charts (aka Widgets) can be configured on trace data received on the Sternum Platform. This example shows the configuration of a widget that graphs the averaging of CPU usage over time:
Measuring EIV Performance Overhead
To evaluate the overhead of EIV between the unprotected and protected firmware, you can use the CRC32 performance test. This test measures the execution time of a CRC32 operation on the device (calculating CRC32 on 1024 bytes, 1000 times). The result time of the test can be seen in the serial output: CRC Profiling Result: <value>.