Enable Observability
This section explains the general process to integrate Sternum observability using the Sternum SDK into a device firmware.
General Process
The general development process to add observability to a RTOS-based firmware is shown on the figure below.
Note that the device requires direct or indirect connectivity to the Sternum Platform to support the observability features.
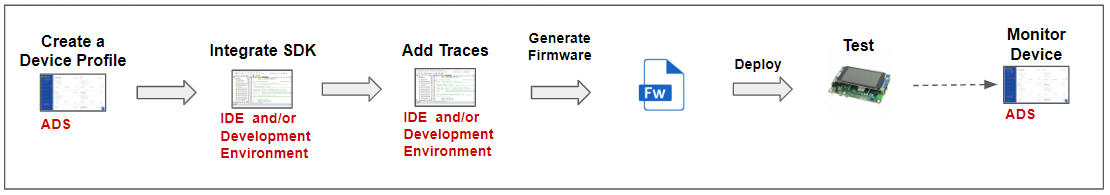
The general steps are:
- Create a Device Profile on the Sternum Platform to model the device and the current version of the firmware
- Integrate the Sternum SDK package into the development environment and firmware.
If RTOS EIV was already integrated, this step is not necessary. - Add traces to the firmware code
- Generate the firmware
- Deploy (flash) the firmware to the device
- Test the protected device
- Monitor the device and view generated traces on the Sternum Platform.
Create Device Profile
The creation of a device profile for the device and firmware is documented in the Onboard Device section of the Sternum Platform Getting Started guide.
Note that this step may already have been done when integrating RTOS EIV in the device.
Integrate the Sternum SDK
This step may already have been done if RTOS EIV has already been integrated. Refer to the RTOS EIV integration details for these steps.
The general steps to integrate the SDK into your RTOS-based firmware are:
- Install SDK package,
- Configure the development environment
- Customize the adaption layer if required
Add traces to the firmware code
In this step, you define traces in SDK Configurator, generate the trace definition files, then create traces with the Sternum SDK API in the firmware code to send key metric, statistic, log and other data to the Sternum Platform.
Refer to the EIV SDK section.
Generate a new firmware
Use the build environment to generate a new firmware, which includes the added trace code and the SDK runtime library.
Deploy the firmware
Flash the generated firmware to the device and reboot it.
Test the device
Connect the device to the network and make sure there is connectivity to the Sternum Platform. Run the general device scenarios and exercise the logic where traces were added. The trace data will automatically be sent to the Sternum Platform.
Monitor the device and view traces
Log in to the Sternum Platform to view the device information and traces generated by the device. Refer to the following sections: