EIV SDK
The Sternum Platform (aka. Analytics and Detection System - ADS) is a cloud-based IoT Platform for IoT device manufacturers and their customers. It provides holistic and comprehensive cybersecurity, asset management and device analytics in one solution.
The EIV SDK - aka. Observability SDK, C SDK, or SDK in this section of documentation - is part of the Sternum SDK familly and provides a set of functionalities to extend device and application monitoring capabilities to RTOS and bare metal devices using the C/C++ language, enabling:
- Broader device visibility
- Richer device analytics
- More effective investigation of device security, behavior and anomalies.
It comprises the following components:
- SDK Configurator - Allows defining and managing traces for each device project
- SDK API - Provides the API and associated library that provide support to send traces to tje Sternum Platform.
Supported platforms
Refer to the RTOS EIV documentation for supported integrations.
Firmware observability
Understanding how a device behaves is key for troubleshooting issues but also can help identify potential security attacks.
The SDK provides a simple way to collect and send any type of data to the Sternum Plaform for both device behavior and security analysis.
The SDK comes with the SDK Configurator, a graphical tool used to manage and define trace definitions.
You start defining the traces and data to collect from the device using SDK Configurator (modeling), then add traces in the code (implementation) using a simple API. The SDK runtime library takes care of local caching (configurable) if the device has no connectivity to the Sternum Platform, and secure trace data transmission to the Sternum Platform.
On the Sternum Platform, you can then view, filter and chart the data, create custom alerts and view potential anomaly alerts generated by Sternum Platform.
Communication model
The SDK supports both direct and indirect communication to Sternum Platform:
Direct communication: The device firmware has a TCP/IP interface (e.g. over Ethernet, Wi-Fi, Cellular) and the SDK can directly sends its data to the Sternum Platform using standard TCP sockets.
This is typically the case when devices have a LAN, WiFi or cellular interface.Indirect communication: For devices that do not provide a TCP/IP interface or cannot support a direct TCP/IP communication to the Sternum Platform, an intermediate device and application - called relay - will be required.
The Relay section of the Relay SDK explains relay applications in more details.
Development process
The SDK uses an optimized mechanism to cache, store and send traces to the Sternum Platform. It uses the concept of traces and trace arguments: You can think a trace as an event type or message type, and trace arguments as the parameters of that event type or messages.
The SDK allows you to define (model) the traces and their associated parameters, generate their associated definition (set of constants) and use these definitions in your code to traces to collect data.
Note that the SDK provides predefined traces, aka. System Traces, that you can reuse without any configuration.
Let's dive into the details of adding traces.
For example, let's assume we want to collect the power information of an IP Camera device and report when a user connects to the camera's embedded web configuration portal. We can define the following traces and trace arguments (note that there are numerous ways to model these traces):
- Trace: Power Info Report
- Arguments:
- voltageV
- powerW
and
- Trace: New User Session
- Arguments:
- userName
During modeling of the traces, we generally want a trace model that allows separation of concerns, extensibility and reuse. Also, separating traces into categories or domain-specific areas will permit easier trace reuse, analysis and investigation on the Sternum Platform.
You then use SDK Configurator to define these traces and arguments.
Once you're ready with all trace definitions, you instruct SDK Configurator to generate the associated trace definition file. This file contains the associated constants and other definitions needed to use the SDK with the target programming language.
In our case, SDK Configurator will generate a C header file that contains the definition of constants for the system and above traces.
You then include this header file to use the SDK API in your code to add traces.
Defining traces
Let's define the Power Info Report and New User Session traces we designed above.
In SDK Configurator, clicking on the IP Camera device profile will open a new view showing the traces and trace arguments.
The default Traces tab shows the list of traces defined in the profile. Similarly the Arguments shows the list of defined arguments.
Let's create the 2 traces by clicking on the ![]() icon:
icon:
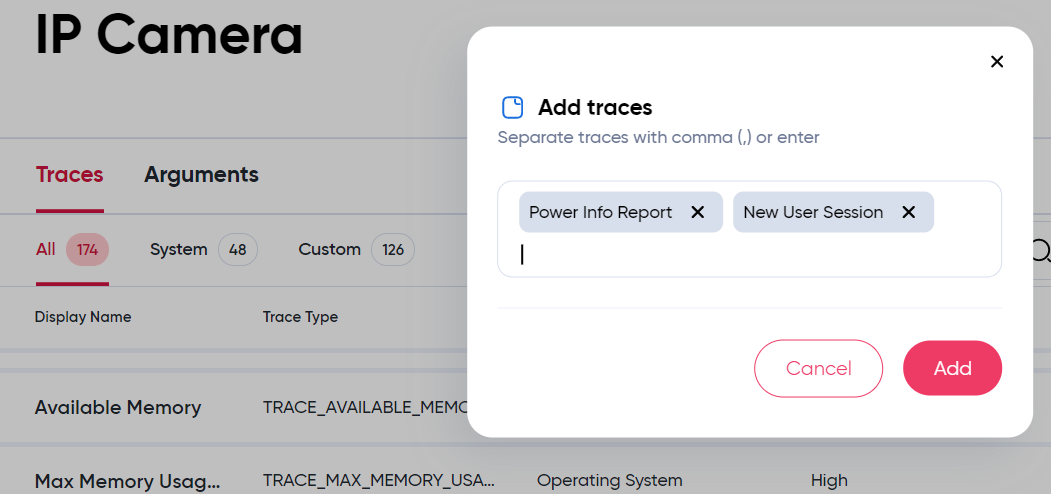
Click Add to create them. A pop up message should confirm that the traces were created.
You can use spaces in the name of traces or arguments when creating them.
You can create multiple traces at once by typing Enter or use a comma between each name. Then click Add to create them all.
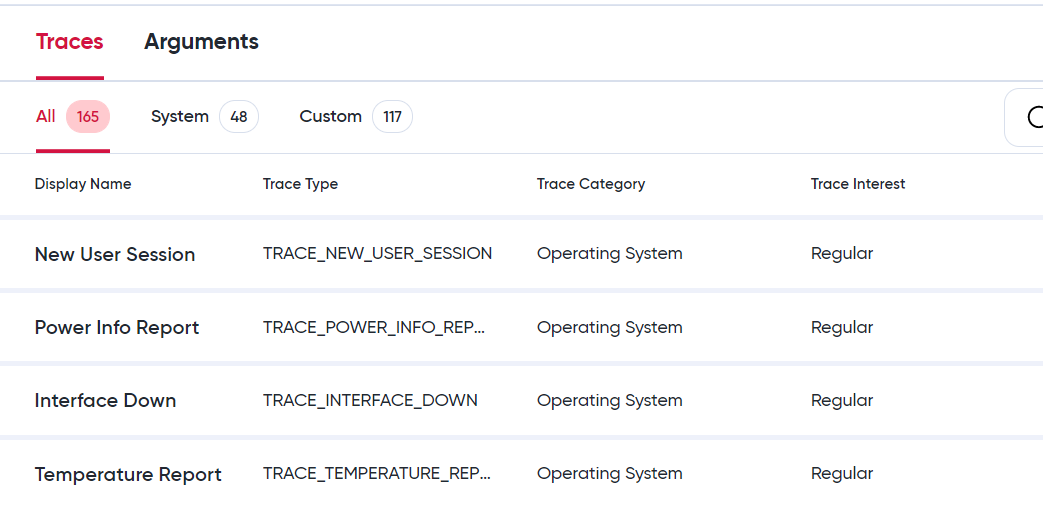
Once added, these new traces will be displayed on the top of the trace list
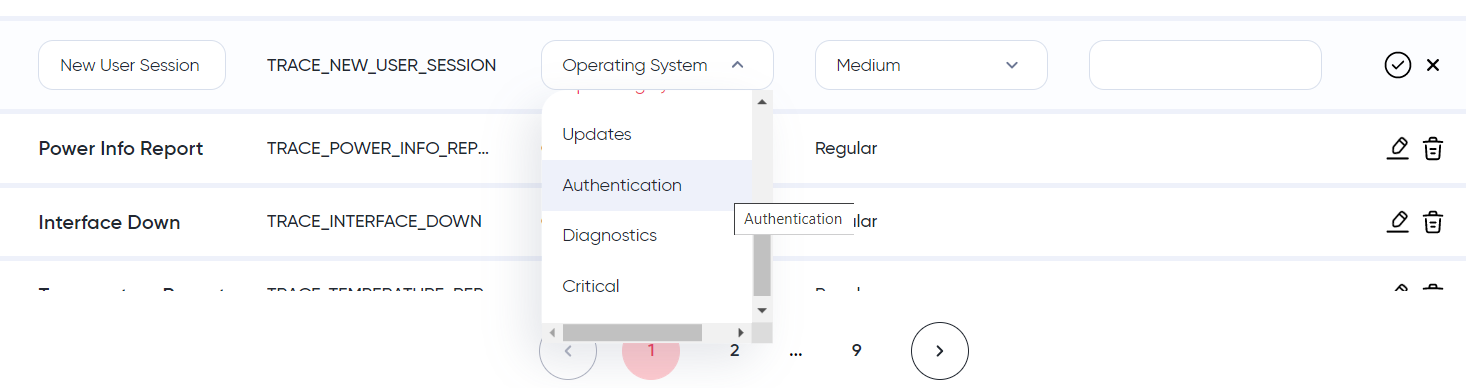
Optionally, we can modify the Category or the Interest of the trace by editing the trace (![]() icon) and selecting the appropriate values:
icon) and selecting the appropriate values:
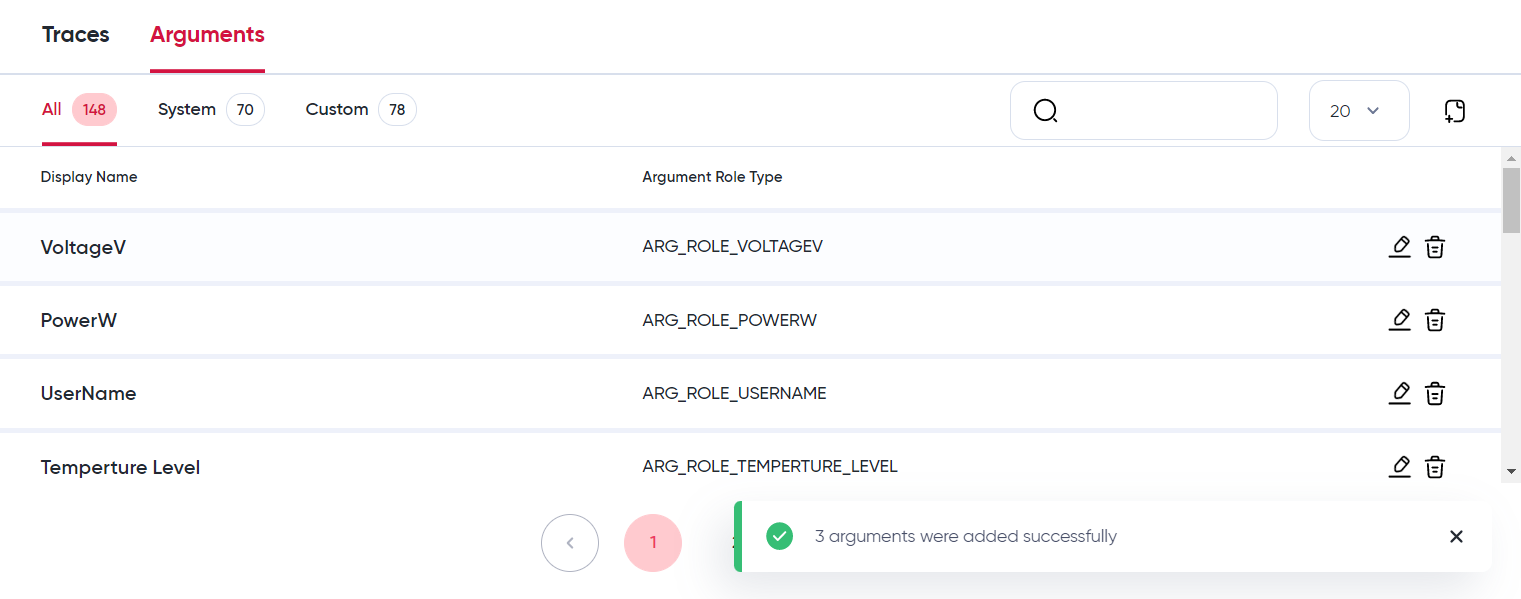
We repeat the same process in the Arguments tab for creating the trace arguments: voltageV, powerW and userName:
The traces are now defined, we can synchronize these new trace and argument definitions with tje Sternum Platform and generate the definition include file using the Sync button.
The type of values associated to a trace to use (e.g. number, string, etc.) is decided by the developer when using using the trace functions.
We can verify the content of the definition file (trace_protocol_user_definition.h) to view the new constants for these traces and arguments:
#ifndef __TRACE_PROTOCOL_USER_DEFINITION_H__
#define __TRACE_PROTOCOL_USER_DEFINITION_H__
...
// Custom Trace Definitions
...
#define TRACE_NEW_USER_SESSION 31487
#define TRACE_POWER_INFO_REPORT 15865
...
// Custom Argument Role Definitions
...
#define ARG_ROLE_VOLTAGEV 8592
#define ARG_ROLE_POWERW 27245
#define ARG_ROLE_USERNAME 13951
...
This file is automatically generated. Do not modify this file as it is automatically generated by SDK Configurator.
Implementing traces
Once you determine where in your code to add traces, you can add the calls to the SDK trace function.
For our traces, the C code will look like:
voltage = ...
power = ...

STERNUM_ADS_TRACE(TRACE_POWER_INFO_REPORT,
        ARGUMENT_FLOAT( ARG_ROLE_VOLTAGEV, voltage ),
        ARGUMENT_UINTEGER( ARG_ROLE_POWERW, power )
        );
and
userId = ...

STERNUM_ADS_TRACE(TRACE_NEW_USER_SESSION,
        ARGUMENT_STRING( ARG_ROLE_USERNAME, userId)
        );
The type of values associated to a trace to use (e.g. integer, string, etc.) is decided by the developer when using the trace functions.
We can now compile and test the new code and view the generated traces on the Sternum Platform.
The Add Traces section dives into the implementation details.