Device View
This screen displays a device’s configuration and all events, alerts and data received from this device.
The date range filtering the device data is configurable through the date range selector in the top right corner of the screen.
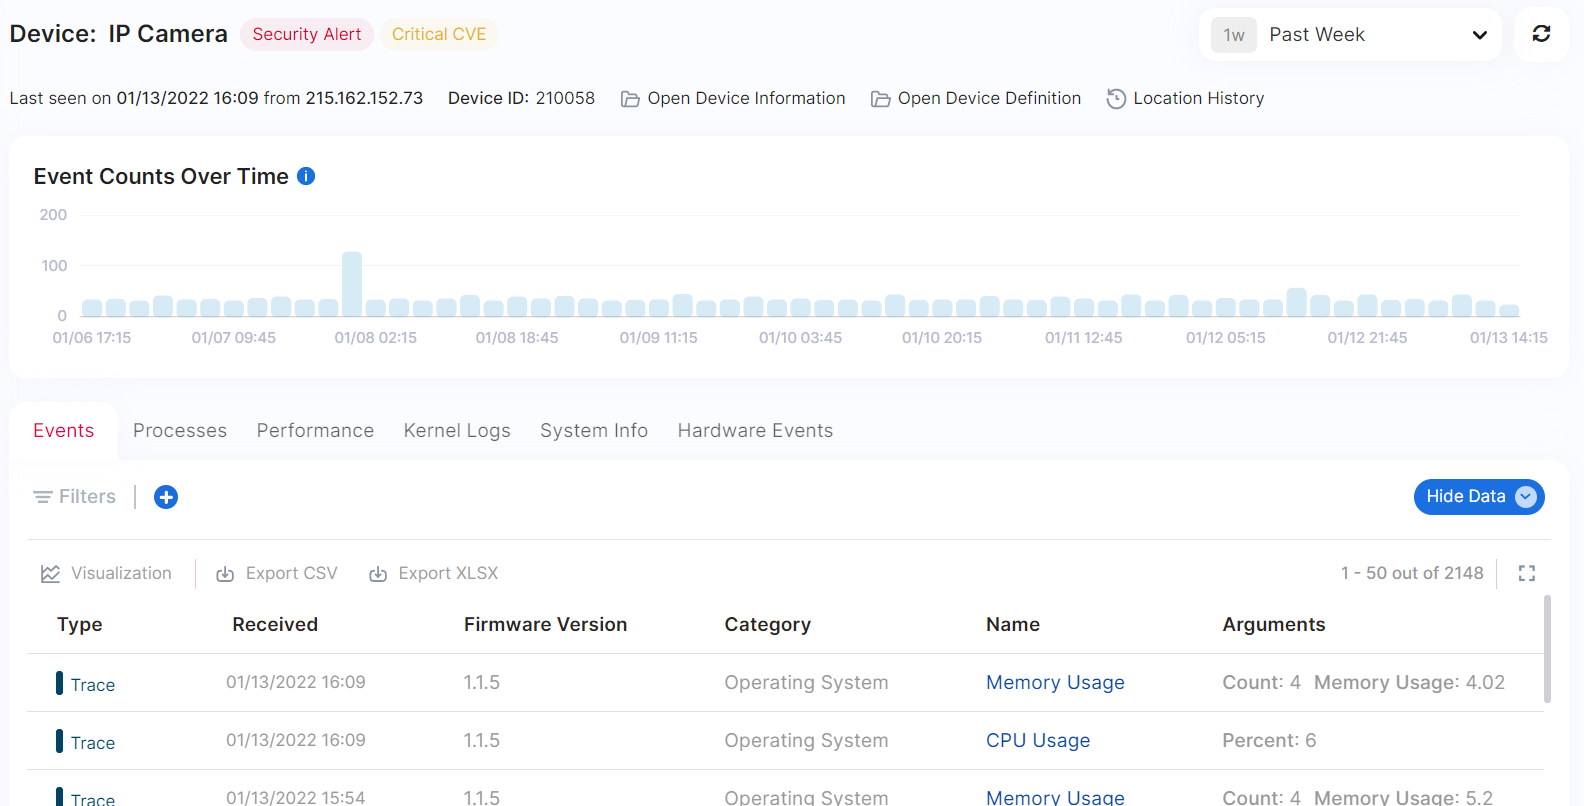
Device Details

The top part of the screen provides the following information:
Timestamp of last event received from the device
Last IP of the device
Device ID
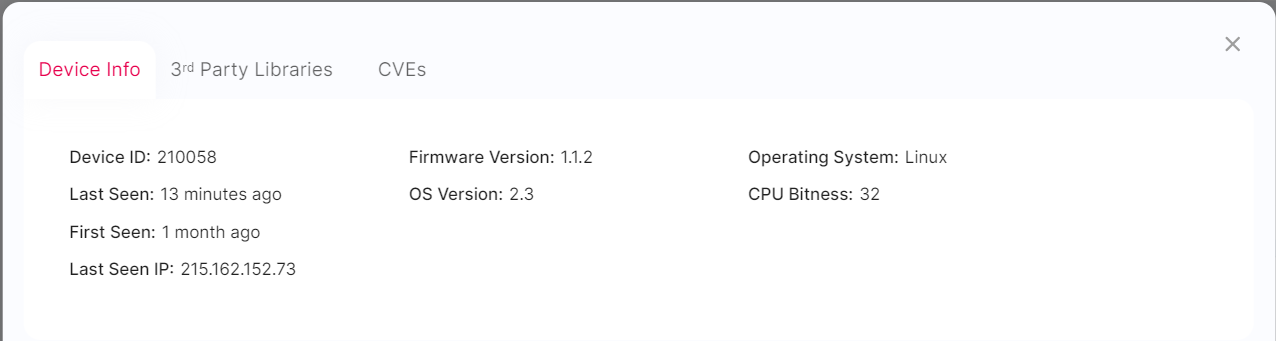
Access to ther firmware information, 3rd-party libraries and CVEs via the Open Device Information button:
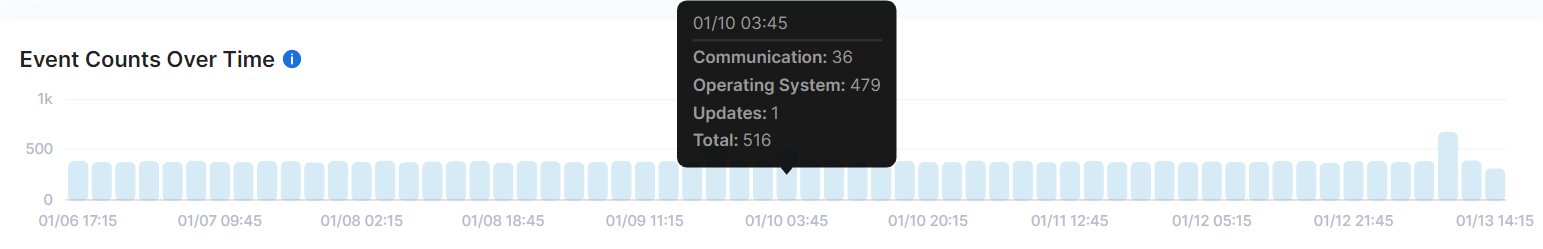
Event Counts Over Time
This histogram presents the number of events and the event types breakdown over time:
Event and Device Data
The bottom part of the screen provides access to the device event KPIs, device event and alert list, and other data which is collected from the device.
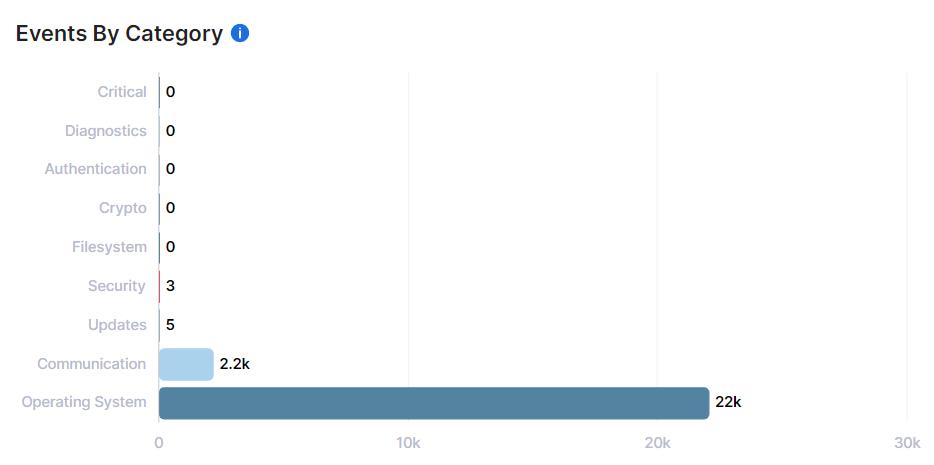
Event Types Breakdown
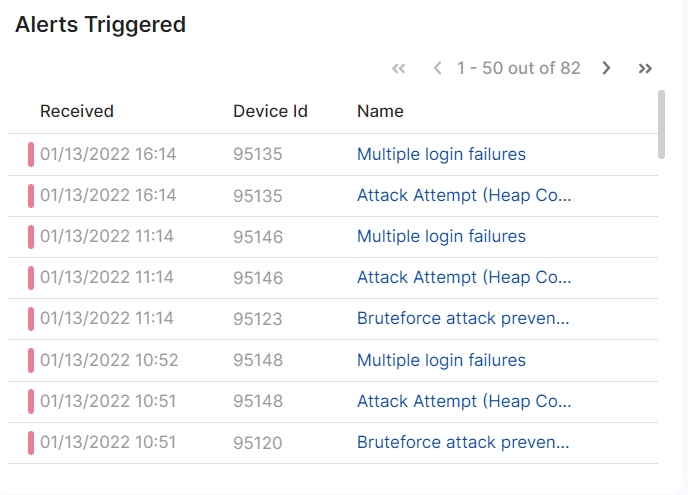
Alert List
This list is similar to the Critical Alerts screen but only shows the alerts for the current device:
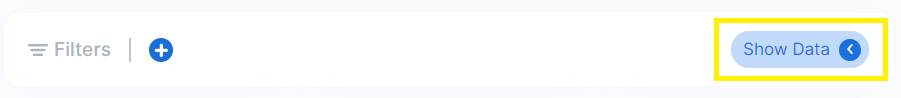
Device Data
The Device data is accessible through the Show Data toggle button on the Filter bar:
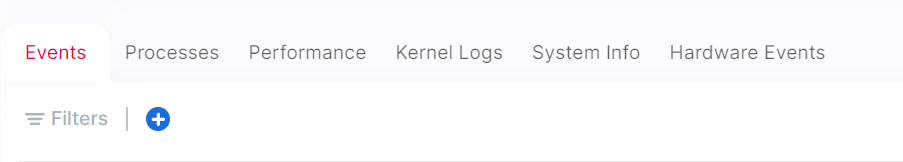
The data available in the various tabs is:
- Events :Event list with predefined and configurable filters.
- Processes : List of processes (Linux device only).
- Performance : Device performance data (Linux device only).
- Kernel Logs (Linux device only).
- System Info : Routing table and disk partition statistics (Linux device only).
- Hardware Events (Linux device only).
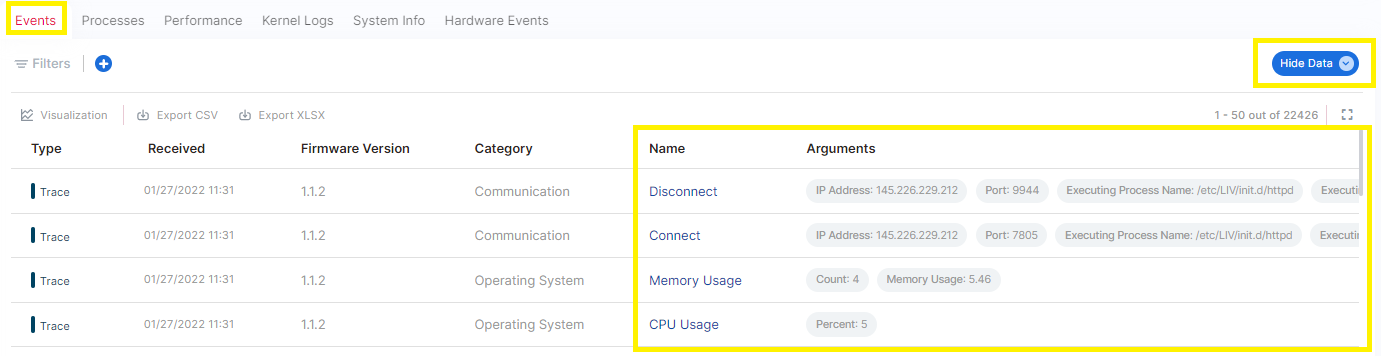
Traces and Arguments
The trace data is displayed in the Name (trace name) and Arguments columns of the Event tab:
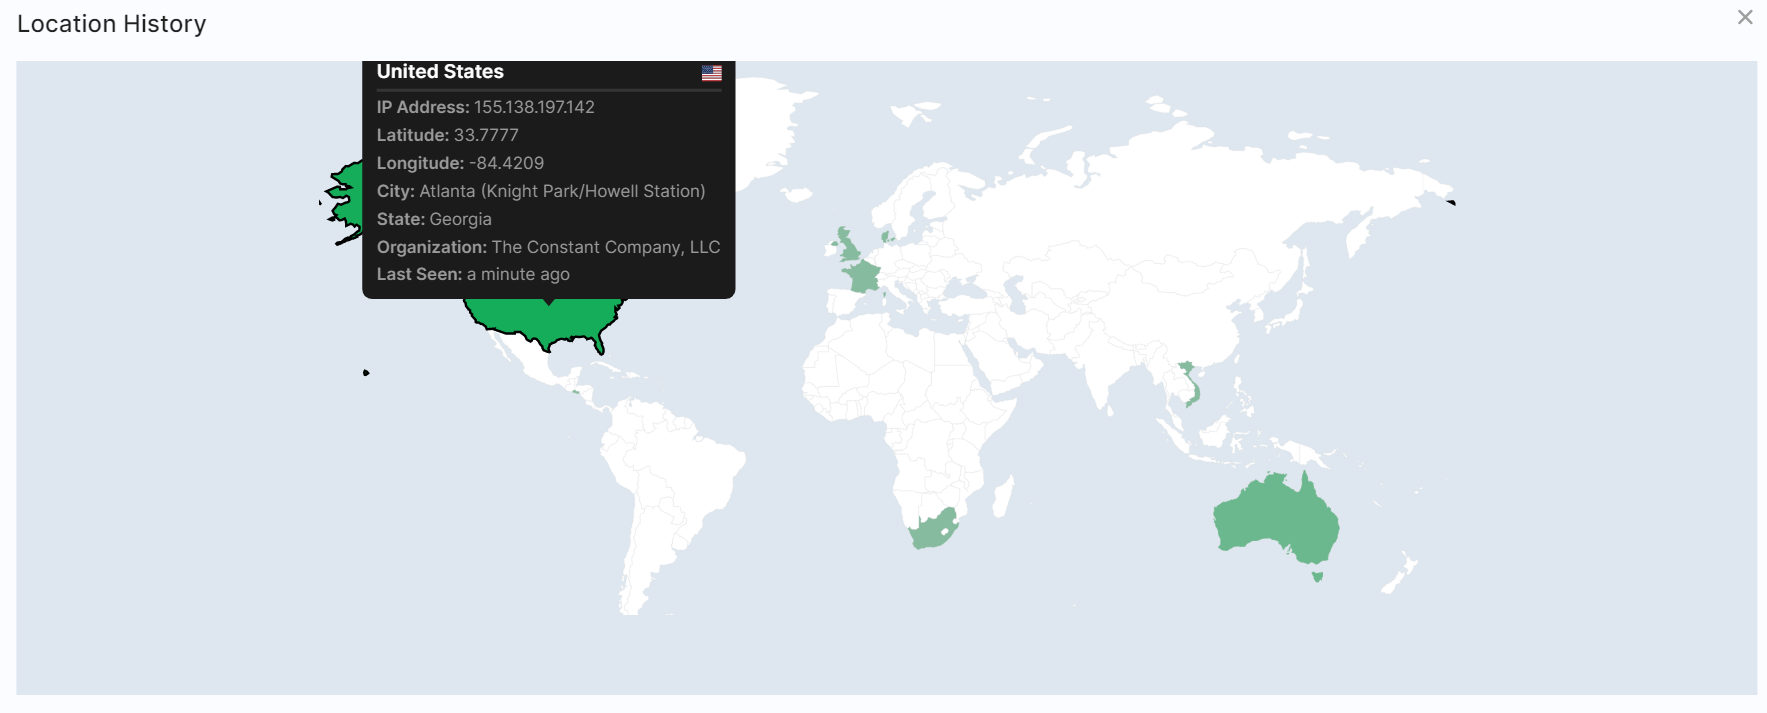
Device Location History
Accessible via the Location History button on the top device info bar, it displays the map of the device’s previous locations (based on IP geolocation) and the related information: