Glances
This screen allows users to monitor devices, create and manage views with their desired KPIs and insights. Both device and 3rd-party library KPIs and insights can be monitored.
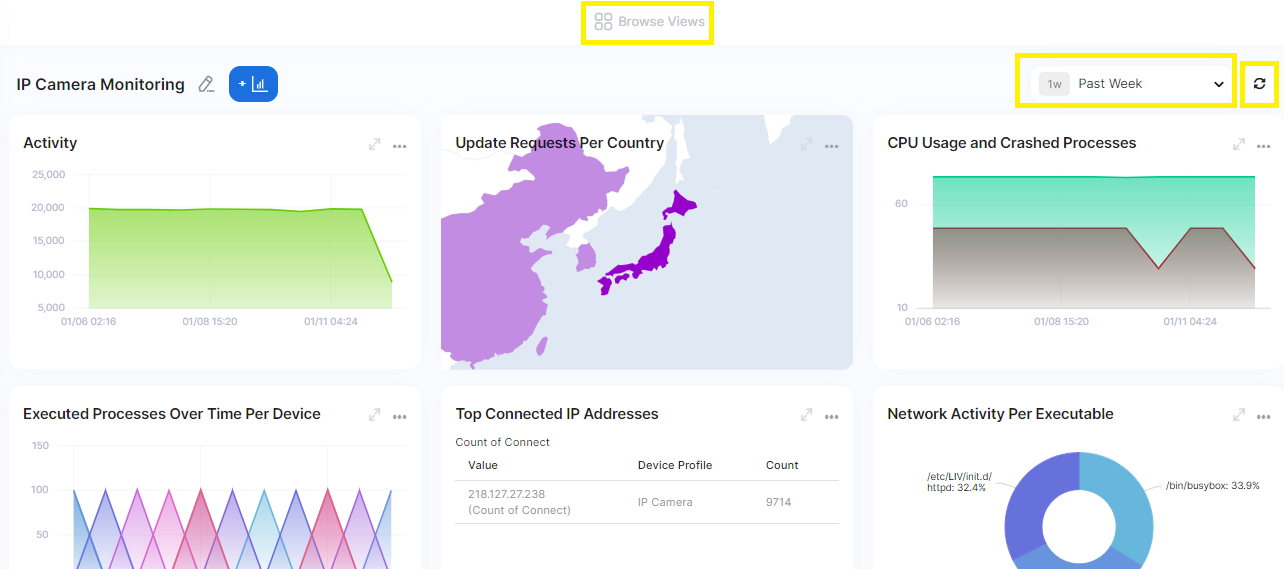
Browse Existing Views
Use Browse Views to view the existing views or create new ones:
Create New View
Use Add View to create a new view:
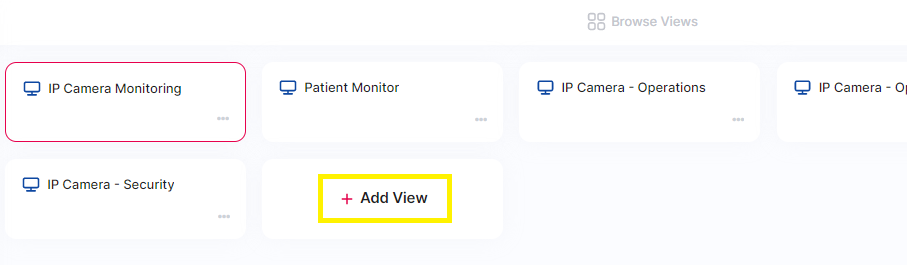
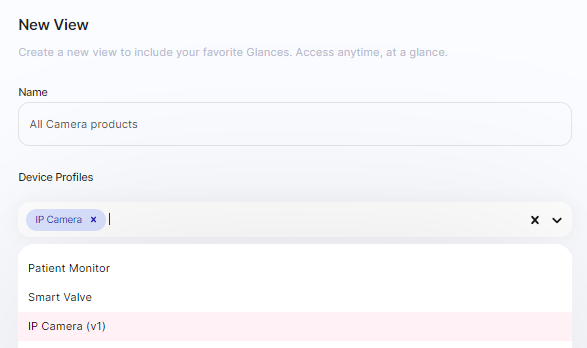
Enter the name of the view and select one or more device profiles for which KPIs and insights will be created, then click Create.
Create New Glance
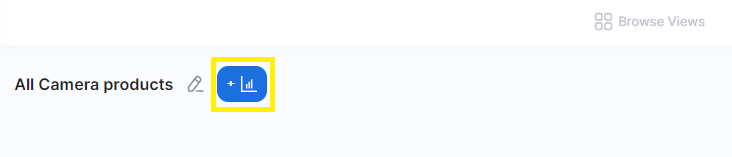
After creating the view, new glances can be created. Click the Add button:
The glance can now be defined.
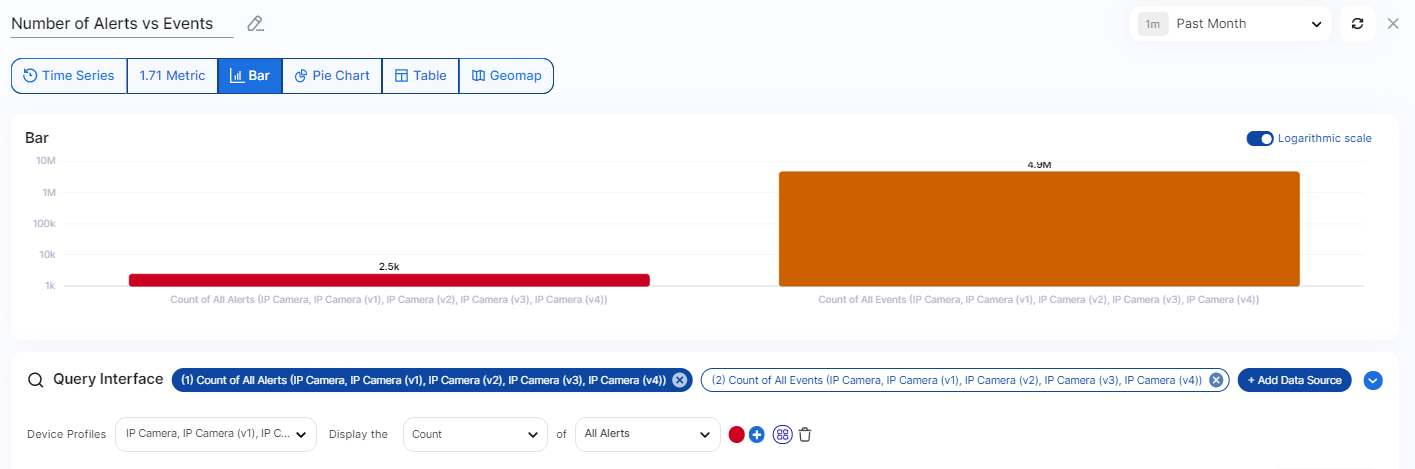
First define the query: Add a data source. A data source is defined by the device profiles and the metric to filter events on.
Repeat with another data source(s) and metric(s) as needed.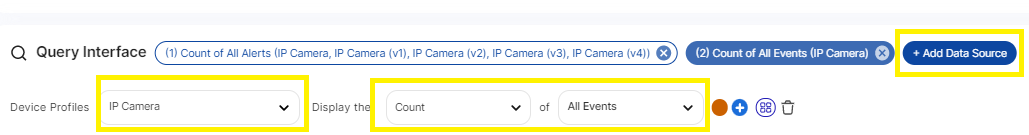
- Then define how to visualize the metric(s). The following visualization types are available:
- Bar chart
- Timeseries
- Metric label
- Pie chart
- Table
- Geographical map
Example of a view showing the number of events vs the number of alerts on a bar chart using an log scale: