Main Dashboard
The Dashboard is the ADS main screen.
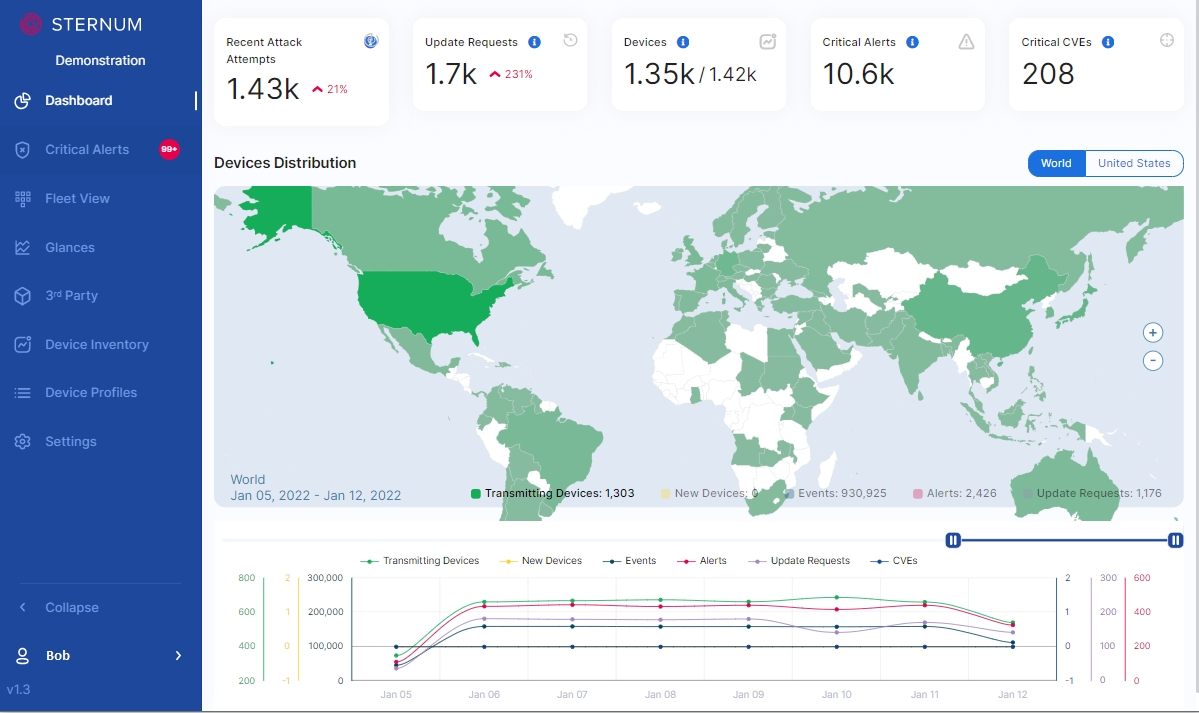
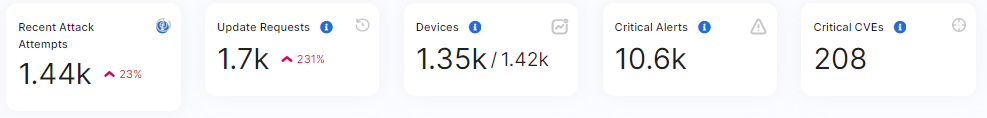
Top Level KPIs
The following KPIs are available at the top of the screen:
- Number of recent attack attempts
- Number of firmware update requests (if supported by the devices)
- Number of devices
- Number of critical alerts
- Number of critical CVEs (also see 3rd-Party Components screen)
The first two KPIs are not contextual (not dependent on the selected date range).
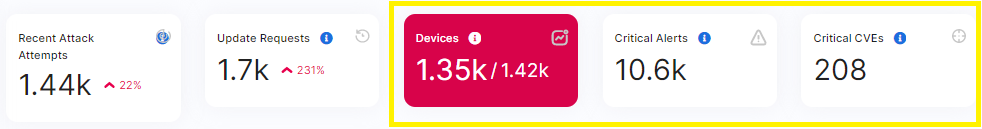
The other KPIs allow users to navigate to the Device Inventory, Critical Alerts and Critical CVEs screens respectively.
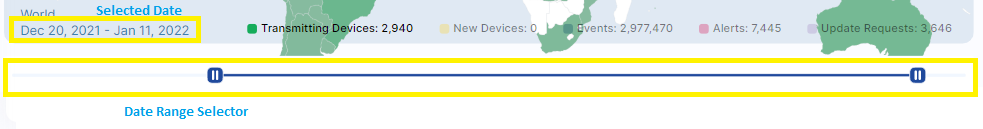
Date Range Selector
The date selector allows to select the date range for the map, charts and KPIs. Both map and chart’s KPIs are updated for the selected date range. Any time range between the current day and the previous 30 days can be selected.
Device Map
The map is contextual to the selected date range and supports zooming in/out.
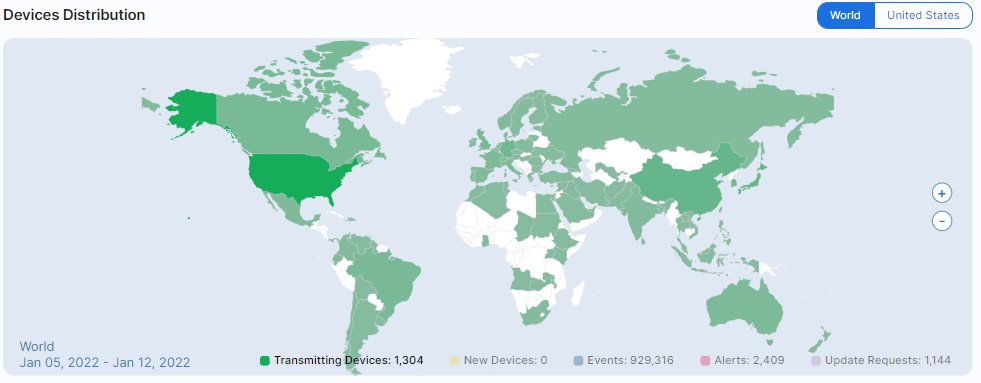
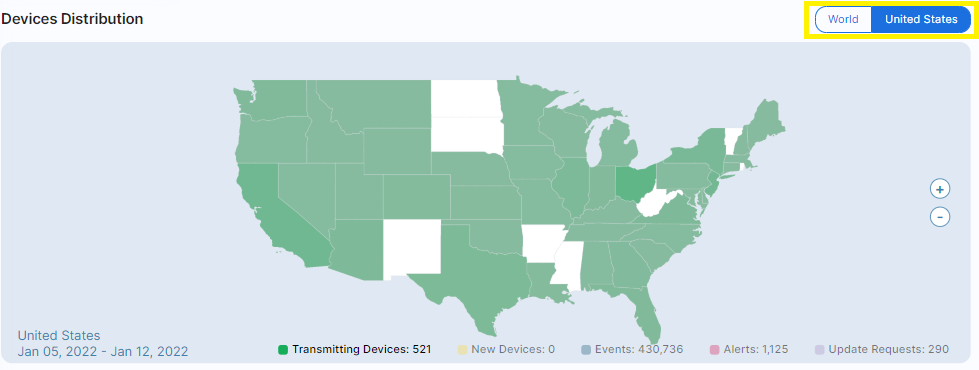
Region Selection
Allows to quickly select between the predefined geographic Areas.
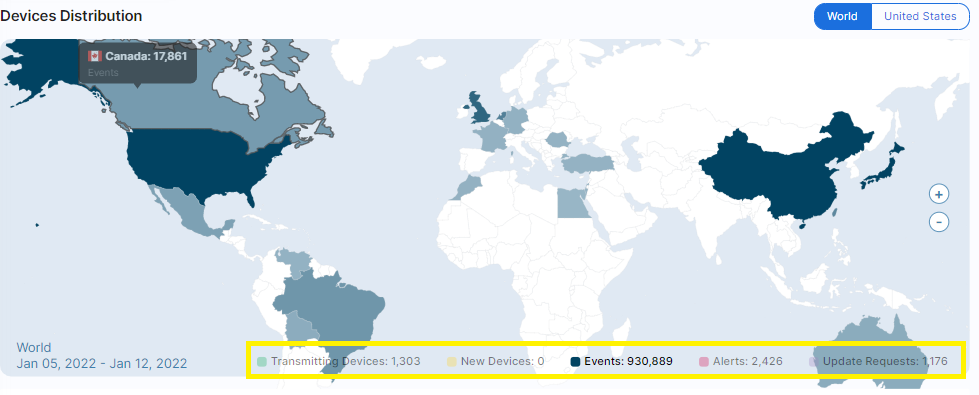
KPI Selection
Allows to select and display one of the predefined KPI and display it on the map.
KPIs Chart
The chart is contextual to the selected date range.
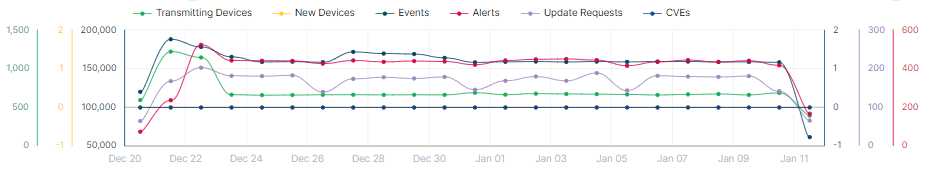
Hovering over the chart displays the details of KPIs:
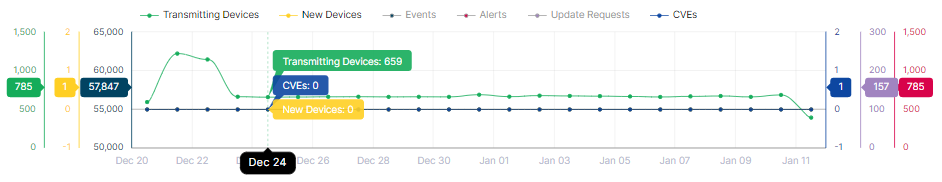
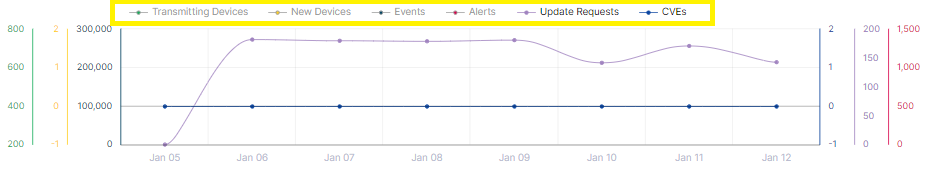
KPI Selection
Allows to select and display the predefined KPI to display on the chart.
Dashboard Notification
ADS will momentarily display the following notification whenever new critical alerts have been received. The alerts can be seen also on the Critical Alerts screen: