Custom Alerts
ADS allows defining custom alerts that trigger based on a set of configurable conditions.
To define a new custom alert, navigate to the chosen device profile and go to Settings (see Device Profiles -> Custom Alerts for more information).
Custom alerts can use any traces/monitoring metrics collected by EIV for the devices associated with the device profile.
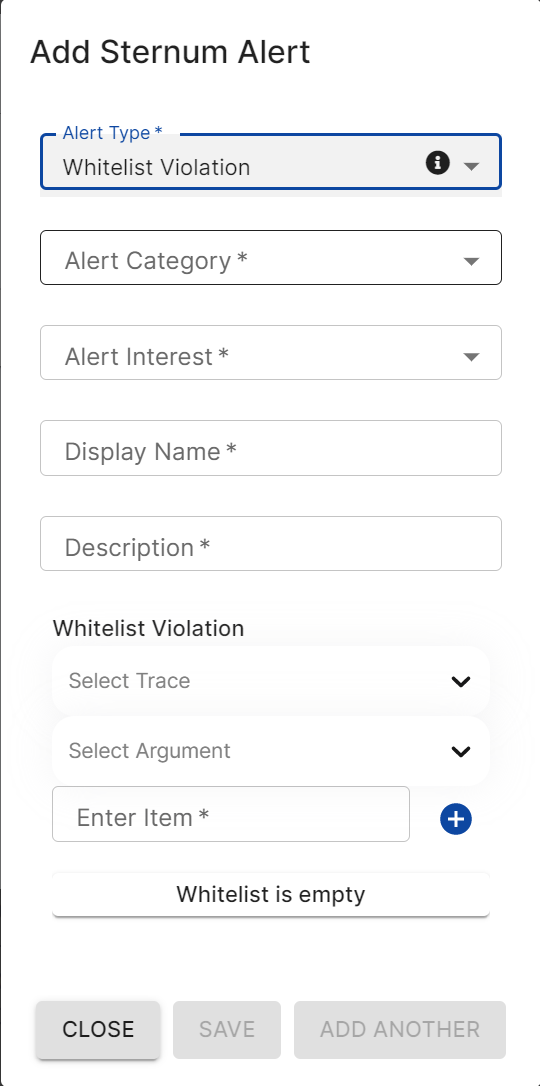
A custom alert is defined by the following properties:
Alert Type: for example White List Violation
Alert Category: for example Communication
Alert Interest: severity of the alert
Display Name: short title for the alert
Description: free text information about the alert
Plus specific properties depending on the alert type as documented below.
Example of custom Alert definition:

Alert Types
The alert type defines what and how metric shall be monitored.
| Alert Type | Description |
|---|---|
| Event Count Over Time | Monitor a metric of type counter against a given threshold and time window |
| New Behavior | Monitor for unfamiliar argument value |
| Specific Behavior | Monitor a metric of recurring events and compare against a given threshold |
| White List Violation | Monitor values of a metric against a given list of allowed values |
Alert Category
Alert category provides a classification of the alert.
| Alert Category | Relates to |
|---|---|
| Authentication | Authentication and access |
| Communication | Communication |
| Critical | Critical items |
| Crypto | Cryptographic operations |
| Diagnostics | Diagnostics, performance and profiling |
| Filesystem | Filesystem operations |
| Operating System | General OS operations |
| Security | Security |
| Updates | Firmware updates |
Traces & Arguments
There are 2 sets of traces and arguments:
The default set of traces and arguments defined and supported by EIV and ADS by default. A sample list is given in Default Traces.
The set of traces and arguments that are specific to your device type (see device profile).
Examples of Custom Alerts
Event Count Over Time Alert Type
Counter Metric Over Max Value Within a Given Time Period
| Alert Type | Alert Category | Metric | Occurrences | Within | Units |
|---|---|---|---|---|---|
| Event Count Over Time | Any | Counter metric | >= 1 | 30 | Minutes |
Specific Behavior Alert Type
Memory Usage Over 75%
| Alert Type | Alert Category | Event | Metric | Condition | Value |
|---|---|---|---|---|---|
| Specific Behavior | Diagnostics | Max Memory Recorded | Size | Greater Than | 75% |
Duration Metric Below Configured Threshold
| Alert Type | Alert Category | Event | Metric | Condition | Value |
|---|---|---|---|---|---|
| Specific Behavior | Diagnostics | Duration metric (e.g. session close) | Duration | Less Than | 30 |
Process Crash
| Alert Type | Alert Category | Event | Metric | Condition | Value |
|---|---|---|---|---|---|
| Specific Behavior | Diagnostics | Exit | Signal | Equals | 11 |
New Behavior Alert Type
User Authentication Success
| Alert Type | Alert Category | Event | Metric |
|---|---|---|---|
| New Behavior | Authentication | Authentication Success | Name |
White List Alert Type
Device Connection to Unknown IP (device outgoing connection)
| Alert Type | Alert Category | Metric | Property | Value |
|---|---|---|---|---|
| White List Violation | Communication | Client Connected | IP Address | List of IP addresses (white list) |
Connection From an Unknown IP (device incoming connection)
| Alert Type | Alert Category | Metric | Property | Value |
|---|---|---|---|---|
| White List Violation | Communication | Connect | IP Address | List of IP addresses (white list) |