SDK Getting Started
This section documents the general development process with the SDK. Refer to the specific SDK for their corresponding installation and configuration, API usage and reference documentation.
Overview
The general process to add observability to your devices is:
- Onboard a test device on the Sternum Platform
- Set up the SDK Configurator to use this Device Profile and your firmware project
- Define the traces and data to collect from the device using SDK Configurator (modeling). SDK Configurator allows you to define the traces and their associated parameters, generate their associated definition (set of constants) and use these definitions in your code to collect data. The SDK provides predefined traces, aka. System Traces and tracing functions to help collect data in your code.
- Add traces in the firmware or application code to be monitored (implementation using the SDK API)
- If the device does not or cannot connect directly to the Sternum Platform, the SDK shall also be used to develop a Relay application running on an intermediate device, which will relay the data from the device to the Sternum Platform. The SDK in the Relay application will manage the forwarding of the device data to the Sternum Platform.
- Build, deploy and run your new firmware instrumented with traces and view traces on the Sternum Platform.
Configure a test device
The very first step before defining or adding traces is to create a Product (aka. Device Profile) on the Sternum Platform. A Product defines a specific product/device type with a specific firmware version. This is needed to distinguish the different devices and versions since their behaviors and traces may be different.
The Sternum Platform documentation explains the concept of Products in details and how to create and manage them.
Set up the SDK Configurator
The installation and general configuration of SDK Configurator is covered in the previous section Installation.
The SDK-specific documentation covers SDK and programming language-specifics.
Define traces
This section provides an introduction to the modeling and creation of device traces using SDK Configurator. All traces must be modeled and defined in SDK Configurator before being able to use them in the code of your firmware or applications using the SDK API.
Let's assume we want to collect the power information of an IP Camera device and report when a user connects to the camera's embedded web configuration page. We can define the following traces and trace arguments (note that there are numerous ways to model these traces, this is one example):
- Trace: Power Info Report
- Arguments:
- voltageV - the input power voltage in Volts
- powerW - the consumed wattage in Watts
and
- Trace: New User Session
- Arguments:
- userName
During modeling of the traces, we generally want a trace model that provides separation of concerns, extensibility and reuse. Also, separating traces into categories or domain-specific areas will permit easier trace reuse, analysis and investigation on the Sternum Platform.
You then use SDK Configurator to define these traces and arguments.
Once you're ready with all trace definitions, you instruct SDK Configurator to generate the associated trace definition file(s). This file contains the associated constants and other definitions needed to use the SDK API with the target programming language.
Defining traces
Let's define the Power Info Report and New User Session traces we designed above.
In SDK Configurator, clicking on the IP Camera device profile will open a new view showing the traces and trace arguments.
The default Traces tab shows the list of traces defined in the profile. Similarly the Arguments shows the list of defined arguments.
Let's create the 2 traces by clicking on the ![]() icon:
icon:
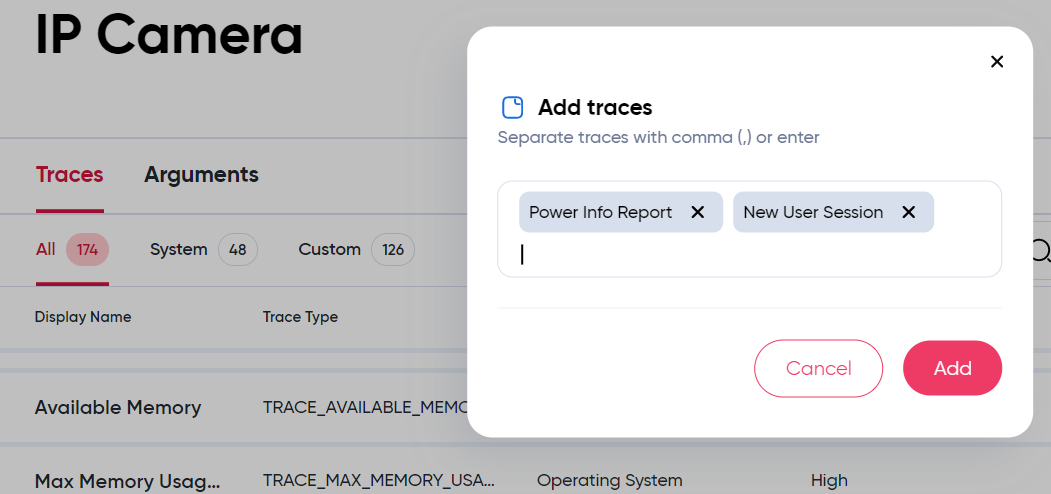
Click Add to create them. A pop up message should confirm that the traces were created.
You can use spaces in the name of traces or arguments when creating them.
You can create multiple traces at once by typing Enter or use a comma between each name. Then click Add to create them all.
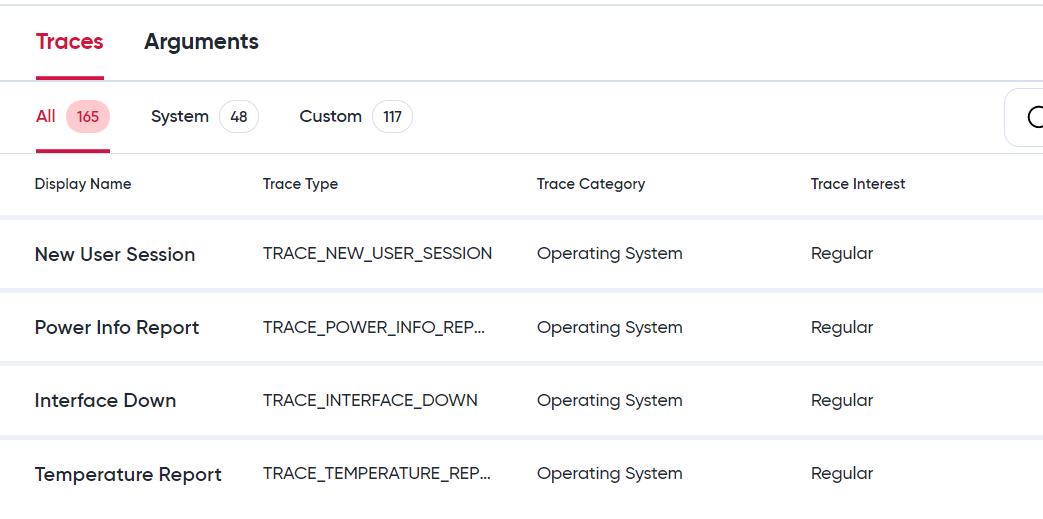
Once added, these new traces will be displayed on the top of the trace list
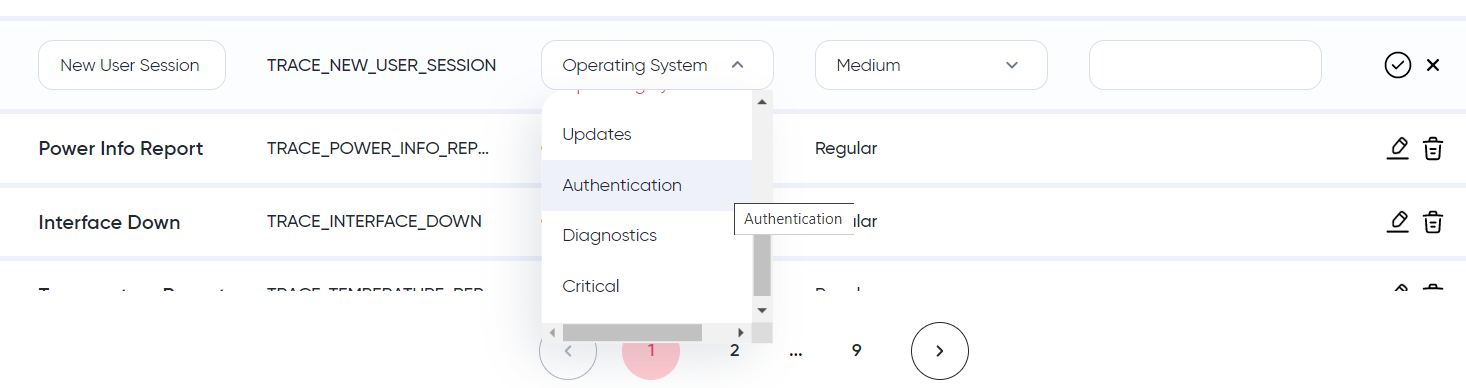
Optionally, we can modify the Category or the Interest of the trace by editing the trace (![]() icon) and selecting the appropriate values:
icon) and selecting the appropriate values:
We repeat the same process in the Arguments tab for creating the trace arguments: voltageV, powerW and userName:
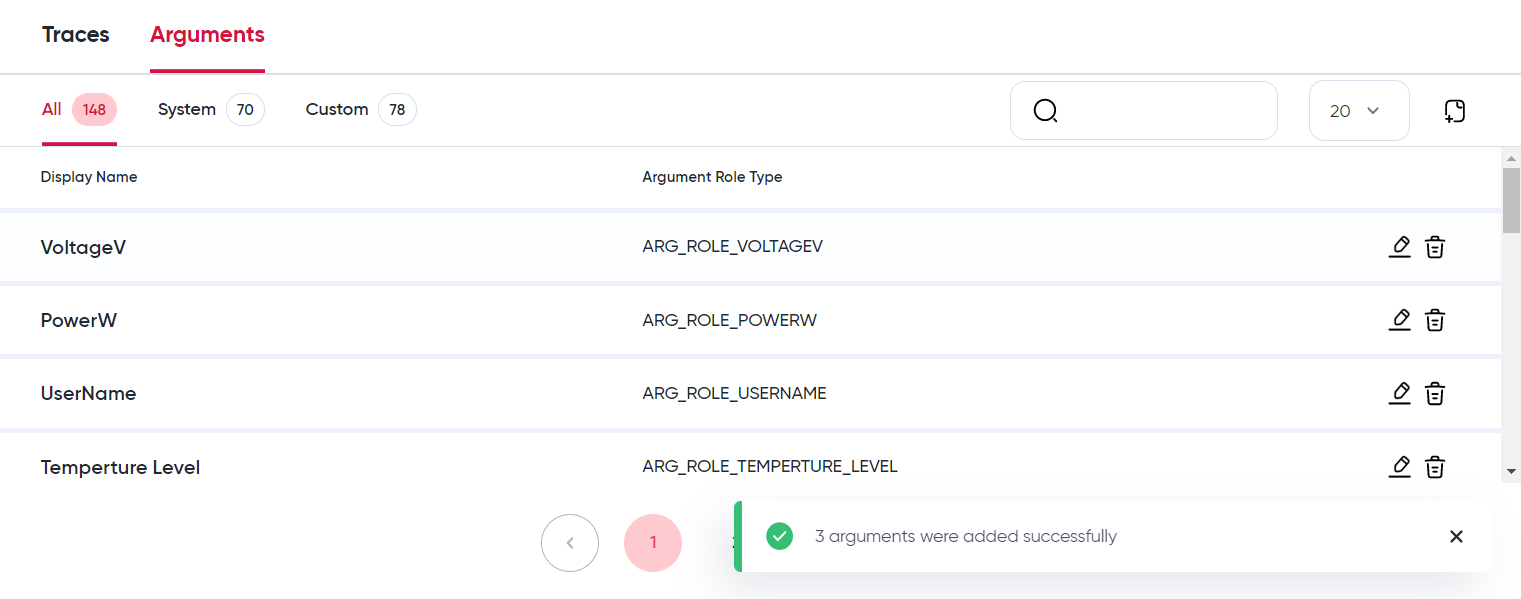
The type of values associated to a trace to use (e.g. number, string, etc.) is decided by the developer when using the trace functions. It is recommended to be consistent and using the same data type for a specific trace argument.
Generating the trace definitions
The traces are now defined, we can synchronize these new trace and argument definitions with the Sternum Platform and generate the definition include file using SDK Configurator's Sync button.
Again here, the specific trace definition file(s) and where SDK Configurator generate it depend on the specific SDK and programming language. Refer to the SDK Configurator setup and the Setup sections of the specific SDK you are using.
For example, when using SDK Configurator configured for a C SDK project, we can verify the content of the definition file (trace_protocol_user_definition.h) to view the new constants for the traces and arguments we created above:
#ifndef __TRACE_PROTOCOL_USER_DEFINITION_H__
#define __TRACE_PROTOCOL_USER_DEFINITION_H__
...
// Custom Trace Definitions
...
#define TRACE_NEW_USER_SESSION 31487
#define TRACE_POWER_INFO_REPORT 15865
...
// Custom Argument Role Definitions
...
#define ARG_ROLE_VOLTAGEV 8592
#define ARG_ROLE_POWERW 27245
#define ARG_ROLE_USERNAME 13951
...
Do not modify these trace definition files as they are automatically generated by SDK Configurator.
Add traces
At this stage, the traces are defined in SDK Configurator and you have generated the trace definition file(s). You can now add the traces in your firmware or application code using the SDK API.
You first determine where to add traces in your code, retrieve the data your want to collect and then add the calls to the SDK API trace function.
The API Reference documentation section of the various SDKs provides detailed examples.
Using Predefined Trace Wrappers
Trace wrappers are utility functions provided within the SDK to simplify the process of sending traces. These wrappers encapsulate commonly used trace scenarios into easy-to-use functions, enhancing user convenience and improving code readability. The data collected from trace wrappers is utilized to populate widgets on Sternum Platform, making the most of the Sternum Platform's analytics possibilities.
The primary purpose of trace wrappers is to make the integration process even simpler. By providing pre-defined functions for frequently performed tracing tasks, developers can efficiently log relevant information without needing to construct trace messages manually. This abstraction layer also promotes code consistency across different applications utilizing the SDK and aids in enabling various widgets on the Platform, enhancing the visualization of data collected through traces.
Here is an example of widgets awaiting data population by trace wrappers. To fill these widgets and obtain meaningful analytics, utilize the corresponding trace wrappers.
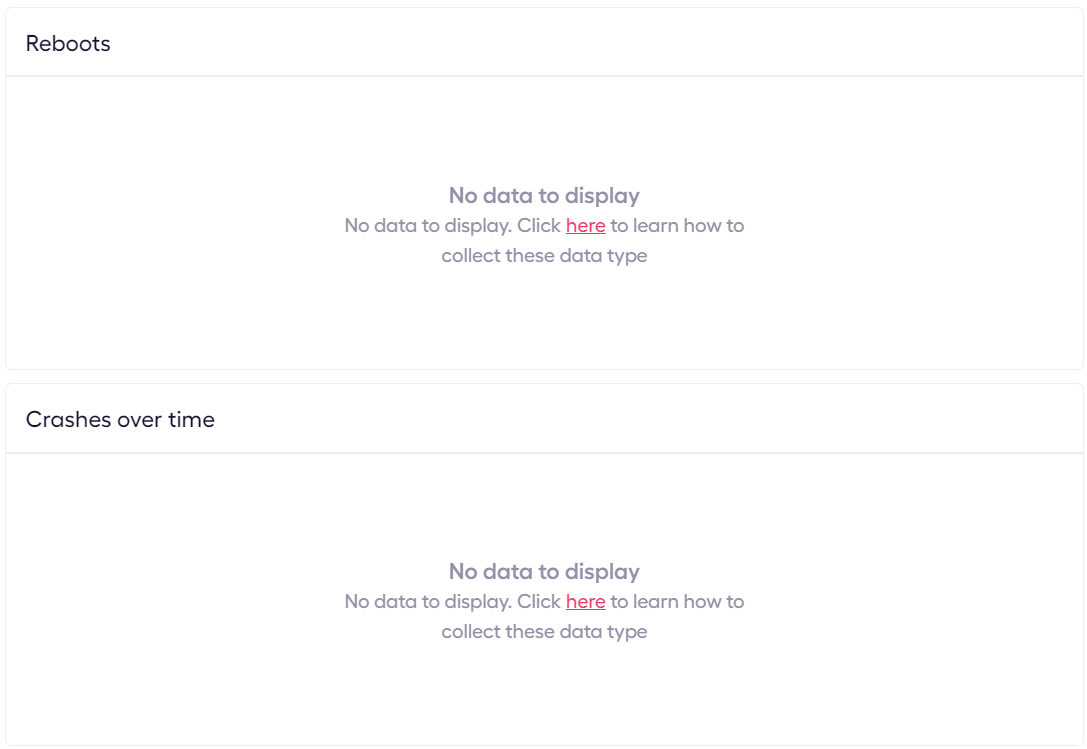
Below is a list indicating which widgets are populated by which trace wrappers:
| Widget | Trace Wrapper |
|---|---|
| Reboots | trace_reboot_reason |
| Top Software Errors | trace_error |
| Crashes Over Time | Varies depending on the SDK; consult your SDK documentation for details. |
Crashes Over time For Linux SDK and Android SDK with Crash Detection support, crash data is collected and crash event is emitted automatically. For Embedded SDK trace_coredump must be emitted from user application.
Trace wrappers are implemented consistently across all supported programming languages within the SDK. Regardless of the programming language used in your application, you can leverage the same set of trace wrappers to log essential information seamlessly.
You will find trace wrappers definitions within the API documentation of your SDK.
Relay applications
The previous section introduced the concept of Relay application.
If the device has direct connectivity to the Sternum Platform (for example via Ethernet, WiFi or cellular), the SDK will manage the collection, caching and secure transmission of the data to the Sternum Platform.
If the device does not or cannot connect directly to the Sternum Platform, the SDK shall also be used to develop a Relay application running on an intermediate device, which will relay the data from the device to the Sternum Platform. The SDK in the Relay application will manage the forwarding of the device data to the Sternum Platform.
The typical cases where a Relay application is needed are:
- The device does not have an IP interface but uses a different protocol to communicate, e.g. Bluetooth, Zigbee, Matter, LoRaWAN. The Relay application for example could be deployed on a mobile device, such as Android or iOS phone, for devices that support Bluetooth.
- The device has an IP interface but the IP network requires the device to connect to an edge or gateway device to reach outside to the Sternum Platform. The Relay application would be deployed on the edge or gateway device.
See the Relay-specific documentation section of the different SDKs. Note that the Relay capability is not available on some SDKs.
Testing traces
After adding the desired traces and made sure the device can directly or indirectly (via Relay) send traces to the Sternum Platform, you can now compile and test the new code and view the generated traces on the Sternum Platform.