Sternum Platform
Overview Dashboard
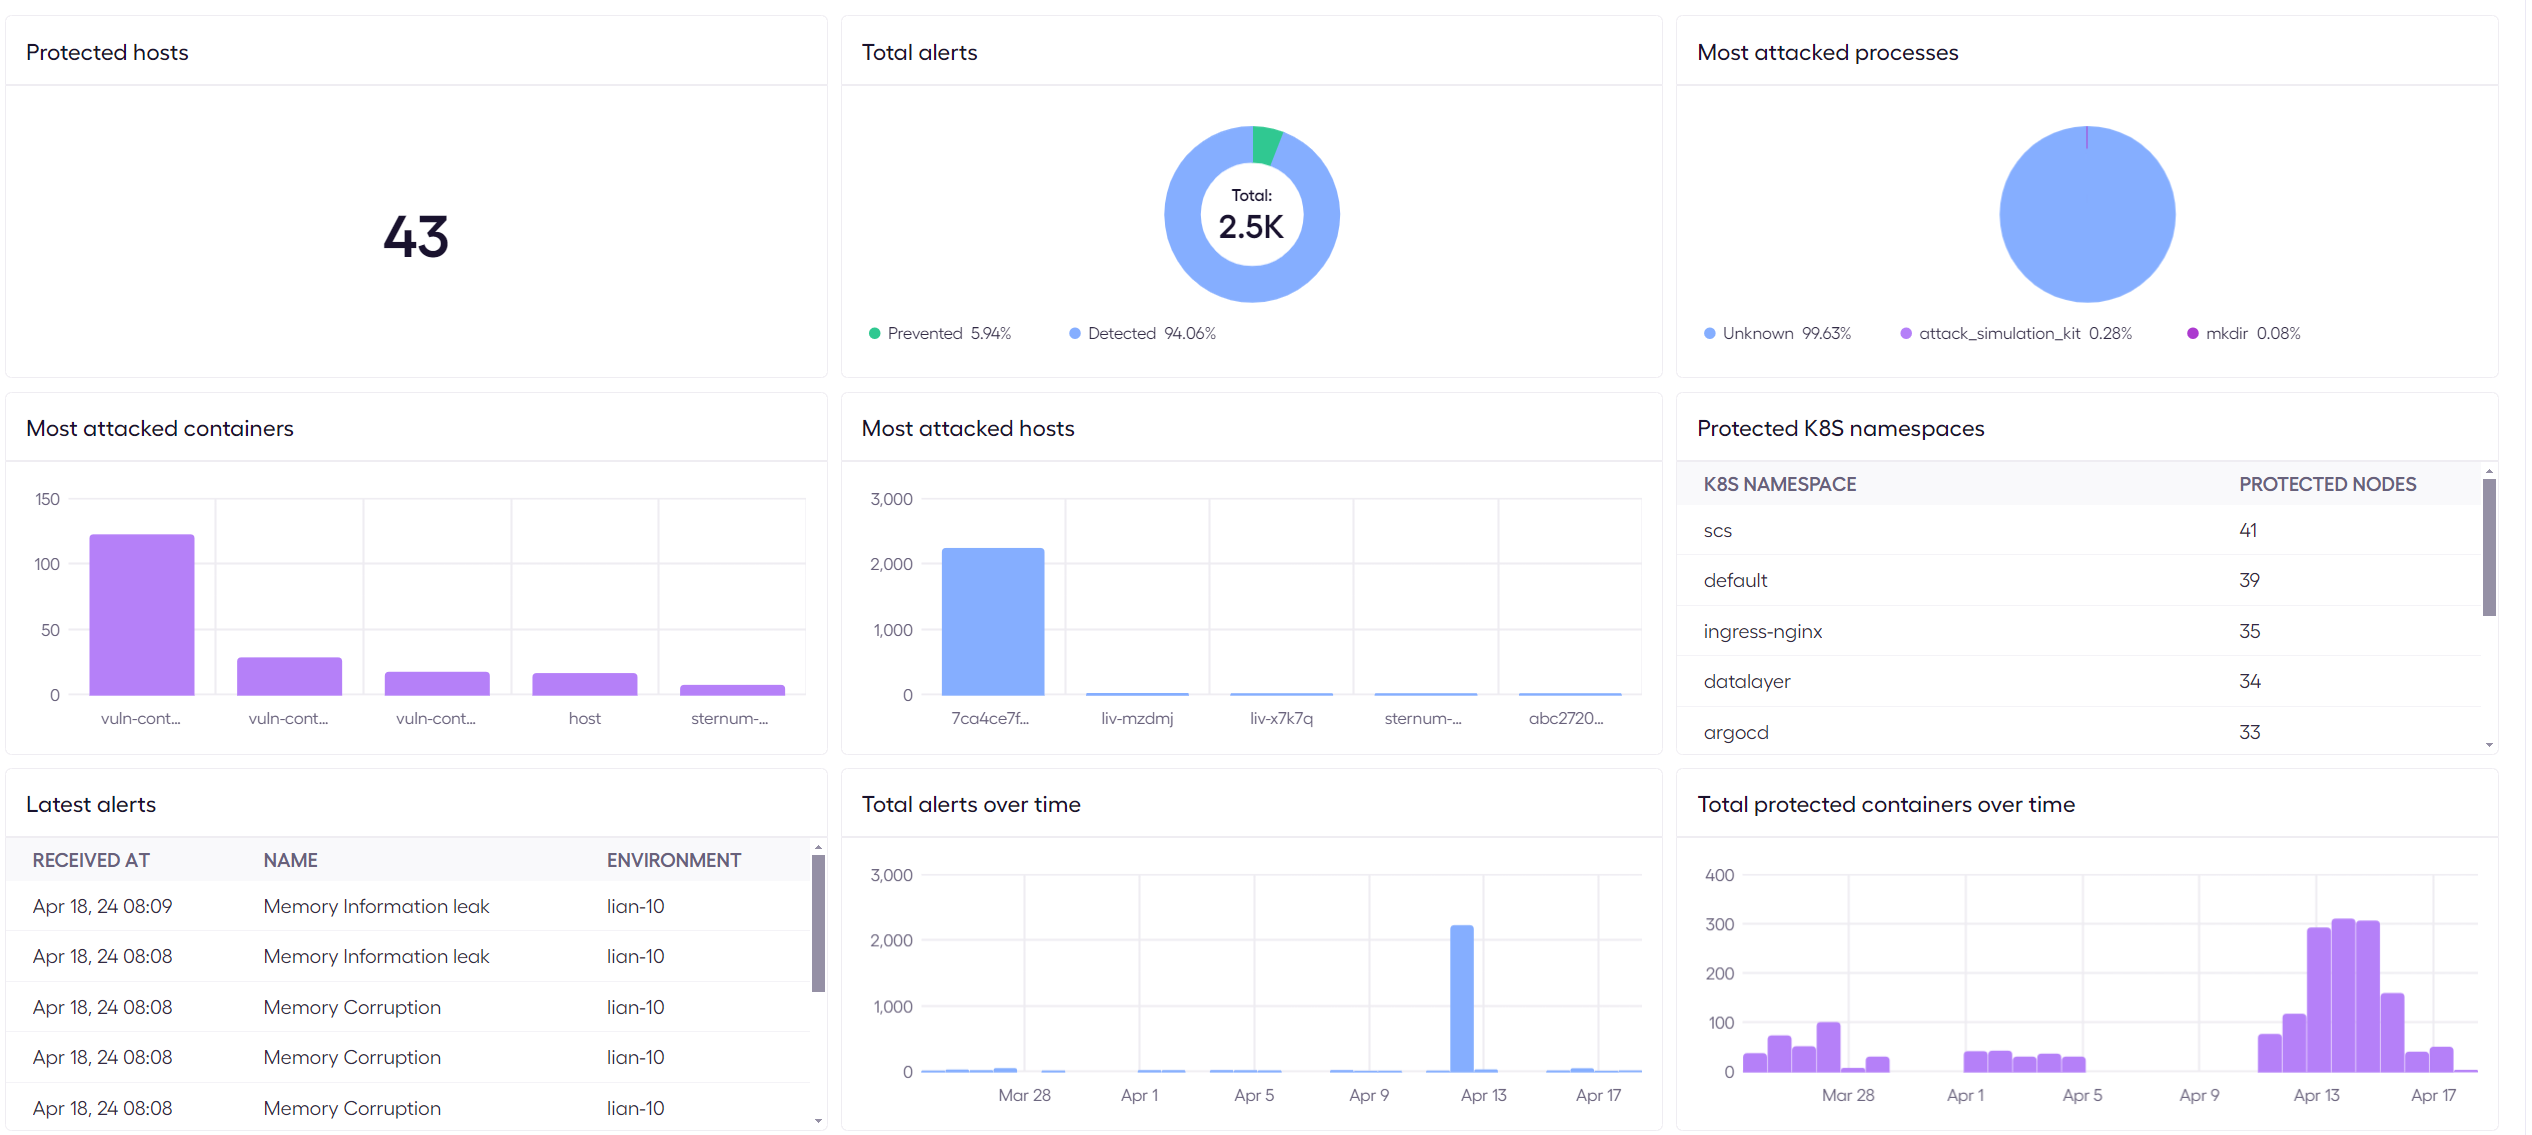
The Overview Dashboard provides a high level summary of your protected environment including alert statistics, most attacked resources, threat trending and more.
Alerts
The Alerts page on the left hand navigation menu shows the runtime security alerts generated by Sternum and allows users to investigate, annotate, resolve or dismiss those alerts.
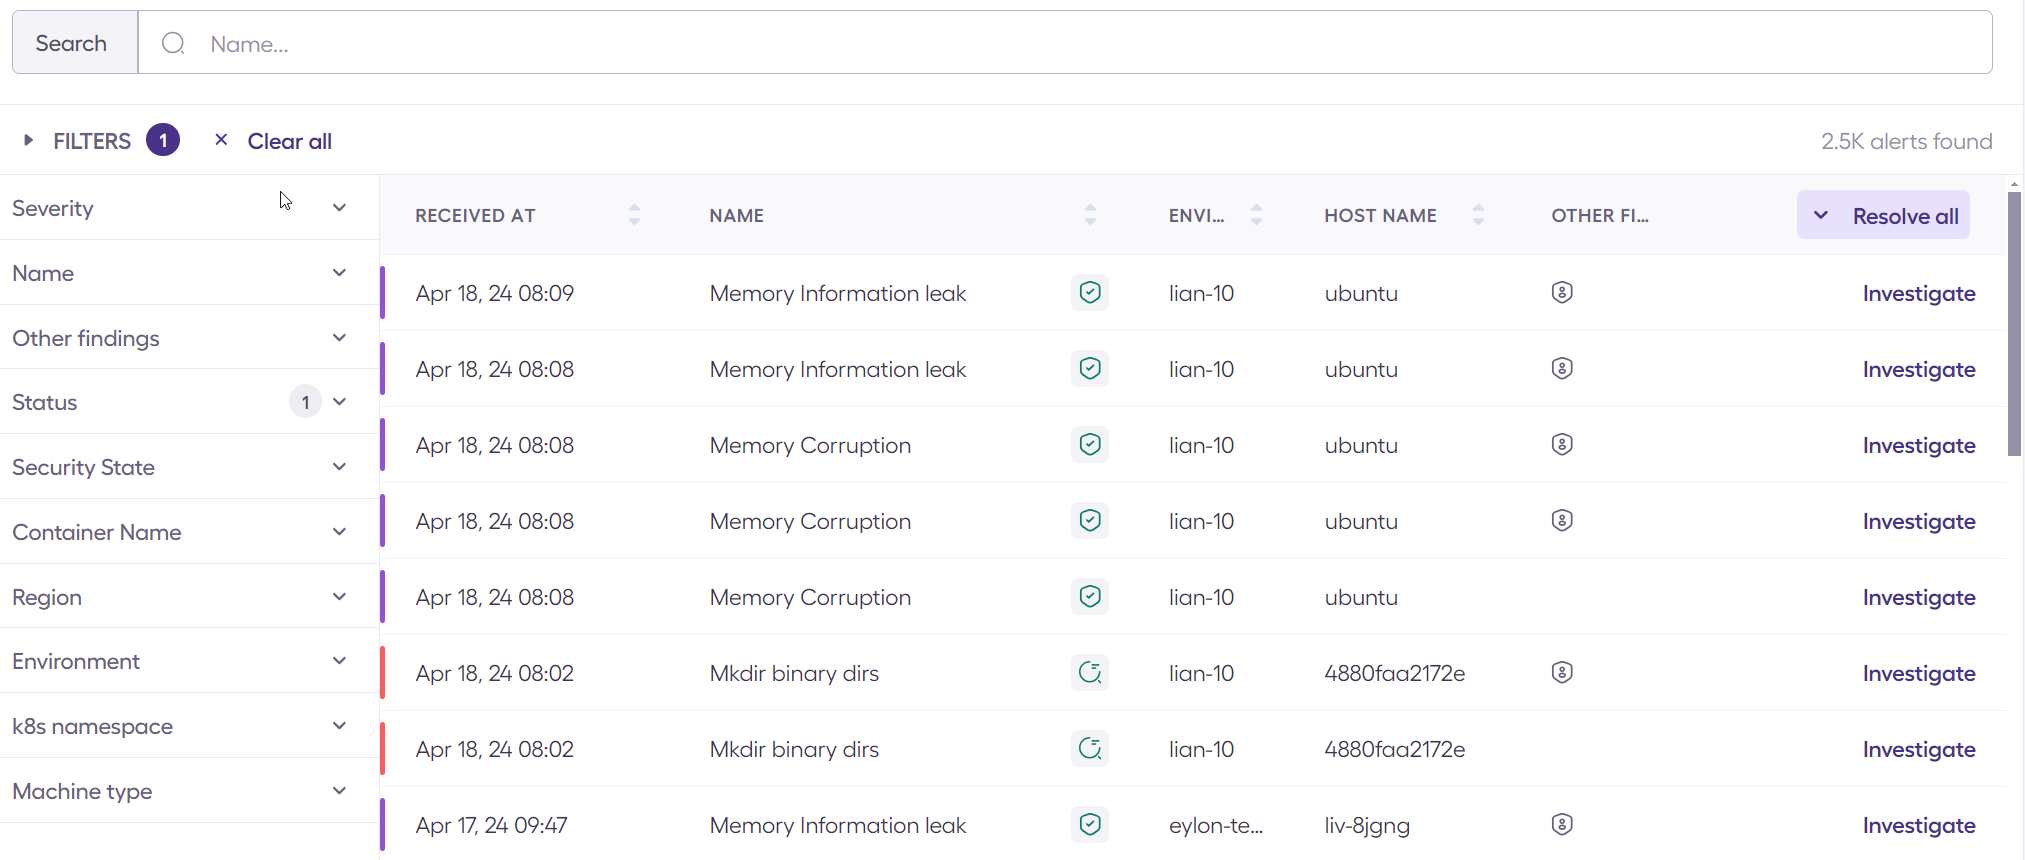
Each column on the Alert page can be sorted using the Up/Down icon next to the column name. The default sort is reverse chronological order of the alert Received At time.
The number of alerts available which match the Search criteria, if set, and the filter criteria, if set, is displayed on the top right, just below the Search box.
The Alert list has the following columns:
- Received At: Date and time alert was raised
- Name: Description of the Alert. Note that a "Remediated" icon will appear in the right side of this column when an attack is remediated/blocked.
- Environment: Where the alert was detected. This value is set during deployment.
- Hostname: From which host/container the Alert was detected.
- Other Findings: Whether previous Alerts were received for this resource
- Resolve/Resolve All: Button to resolve alerts
Time Range Filter
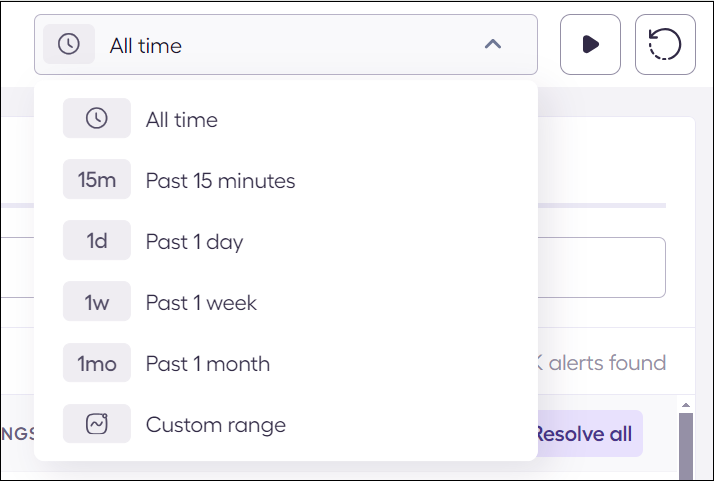
The selection of the alerts being displayed on the Alert page is driven by the selected time range and polling interval. By default, all alerts are displayed from across All Time. You can filter based on a time range by selecting the appropriate time range from the dropdown or define your own custom date range. The interval at which new alerts are displayed is configurable as well as whether you would like to pause the automatic polling for new alerts.
Alert Severity
On the left border of each alert row, a vertical line in different colors represents the severity of the alert:
| Severity | Color |
|---|---|
| Critical | Purple |
| High | Red |
| Medium | Orange |
| Low | Green |
Alert filtering
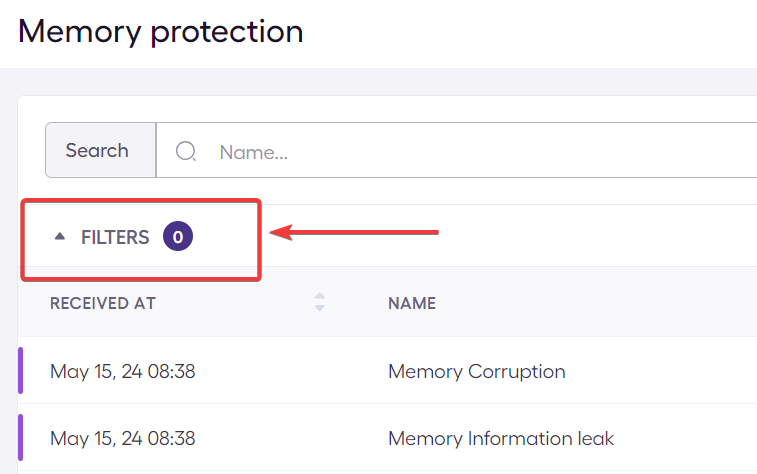
The Filters panel on the left, allows users to search and filter for specific alerts based on various criteria.
If you do not see the Filters listed on the left side, click on Filters to collapse/expand the Filters menu.
Alerts can be filtered based on:
- Severity
- Name
- Status
- Security State
- Container Name
- Region
- Environment
- Other Findings
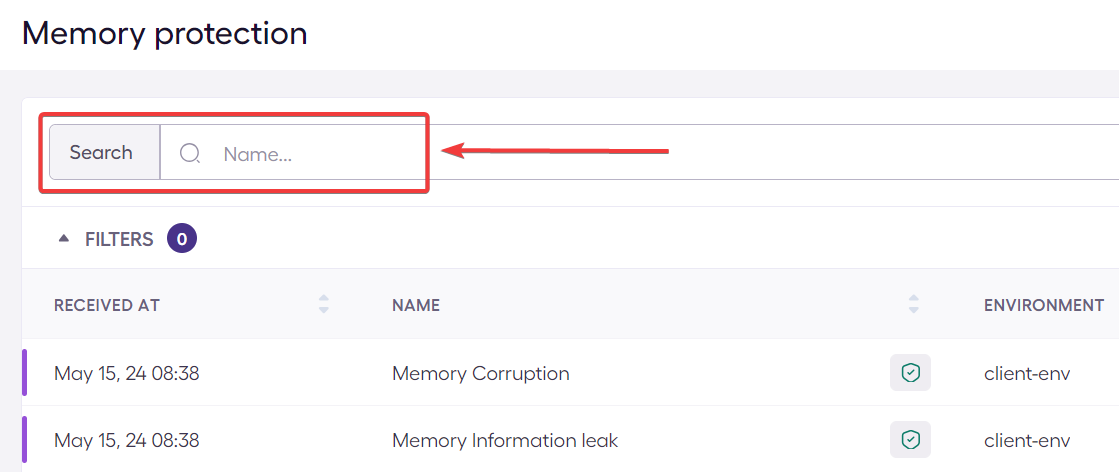
Searching for alerts
The Search box allows users to search for specific events. The search performs full-text search on the alert Name.
Resolving and Dismissing Alerts
Use the Resolve or Dismiss buttons in order to either tag an Alert as Resolved or Dismissed. An alert can be Resolved or Dismissed for a number of reasons, e.g. the incident has been resolved or the associated resource was terminated. When resolving or dismissing an alert, an optional reason can be provided.
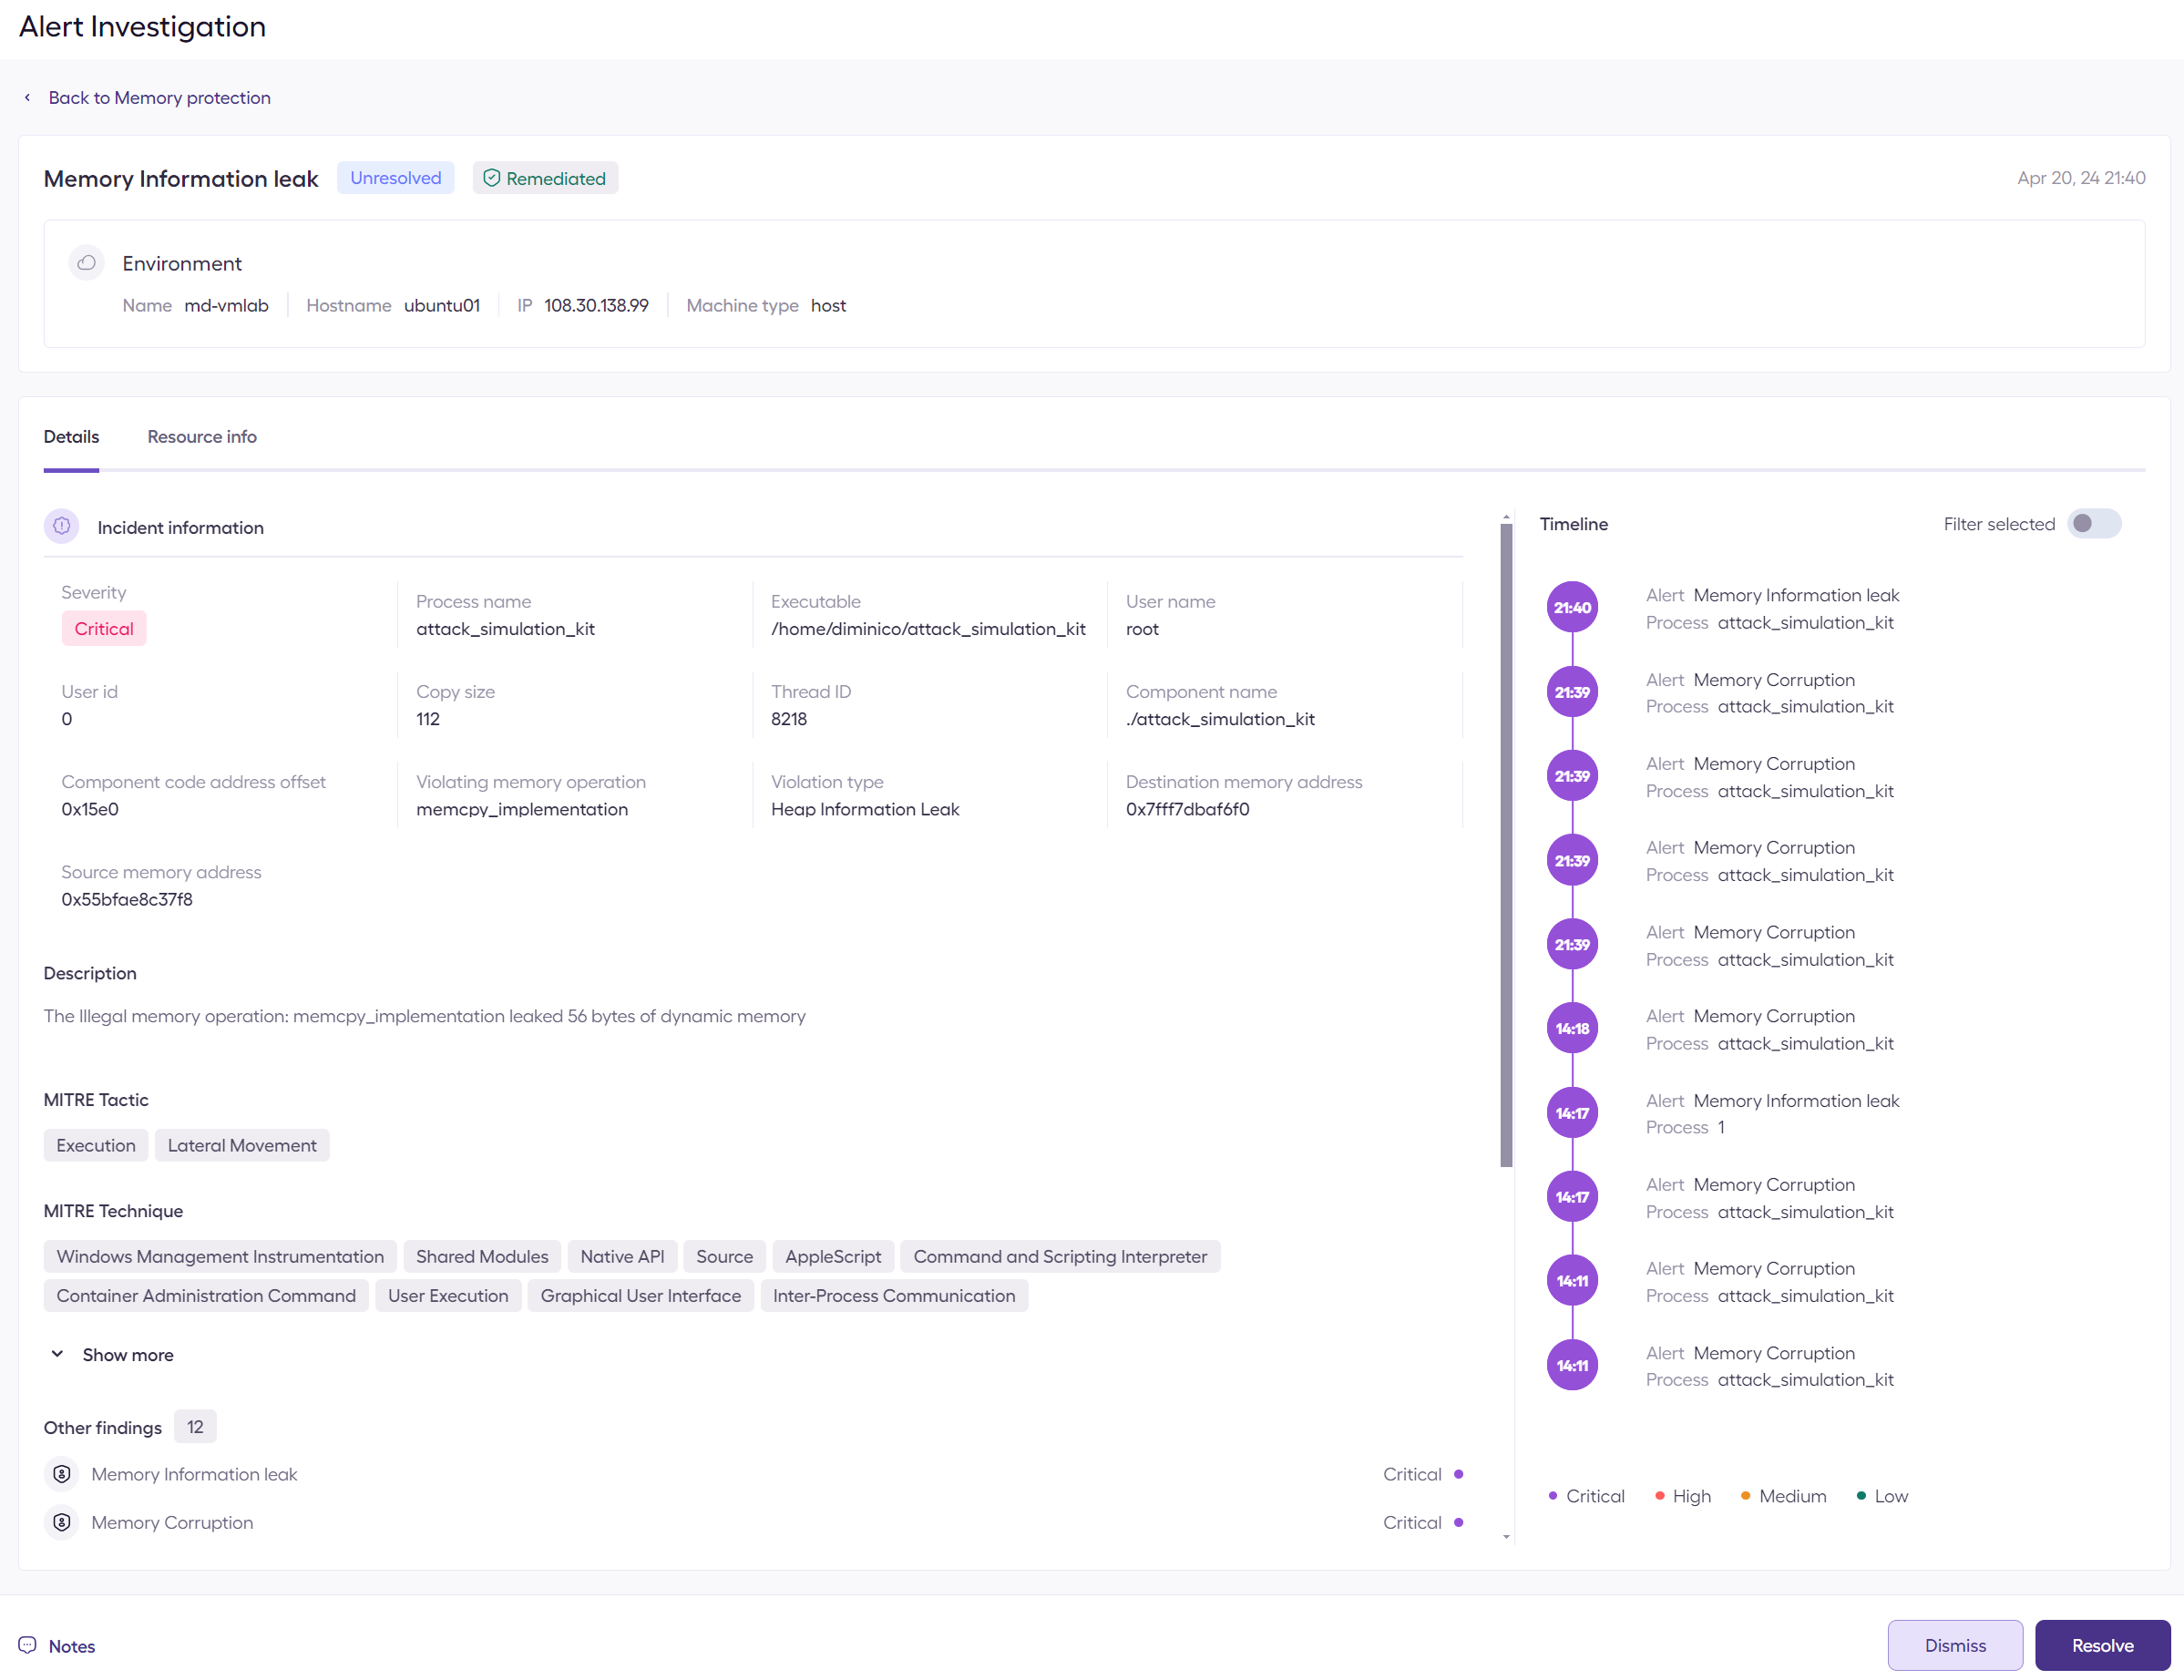
Alert Investigation
By clicking on Investigate to the right of an Alert, the user is taken to the alert investigation screen and provided detailed information about the alert, including:
- Alert name
- Alert status (Resolved or Unresolved)
- Alert date
- Environment details
- Resource Info tab
- Incident information
- Timeline of events
- Notes
- Disposition buttons (Dismiss and Resolve)
Alert Details tab
The Alert Details tab provides incident information including:
- General info: process name, executable and command that triggered the alert, user ID and name, and alert severity
- Alert description
- MITRE information: Tags providing information on MITRE Tactics and Techniques associated with the alert
- Other findings: Tags or links that provide various information about the alert, for example:
- High/Critical CVE or misconfigurations that affect a component that is running by this container/host
- Link to other runtime alerts with Critical or High severity detected in the last week (for the same Container/Host)
- And more.
- Tags: Information about the rule that triggered the alert.
Resource Info tab
This tab displays the various contextual identifiers of the impacted resource, e.g. K8, container and AWS identifiers.
Timeline of events
The Timeline of events shows the list of the Alerts and Events associated with the affected alert which occurred before the selected alert took place.
Alert management
The Sternum Platform allows users to easily manage alert lifecycles via the alert state, disposition buttons and multi-user notes attached to alerts.
Resolve/Dismiss flow
Each alert has one of the following states:
- Open / Unresolved: The alert is new or under investigation. This is the initial state of an alert when it is received.
- Closed / Resolved / Dismissed - A user, with appropriate permission, investigated the alert and closed it.
A user can resolve or dismiss an alert by using the Resolve/Dismiss buttons in the Alert list view or at the bottom of an Alert Investigation page. The user can also provide the reason to resolve or dismiss the alert. Resolving or dismissing an alert moves the alert to the associated Closed / Resolved / Dismissed.
A user can also reopen a closed alert.